 Sign-up for free online course on ANSYS simulations!
...
Here are the steps for generating a plot of Nu vs Pr for a chosen Re = 40,000x (say, 10,000 for, say, Pr = 1,3,5 and 7.
For Pr=1, go to the csv file exported from CFD Post and read off the Nusselt number value for Rex = 4010,000 (this process is shown in the Nusselt Number Variation video above). This is the Nusselt number for Pr=1 at that Reynolds number Rex.
Change Air Cp in Fluent under Setup>Materials>Fluid>Air (to get a Pr=2, you need to double the Cp value for air, ; note that the values below may be wrong, the picture is just for locating where to to change Cp)
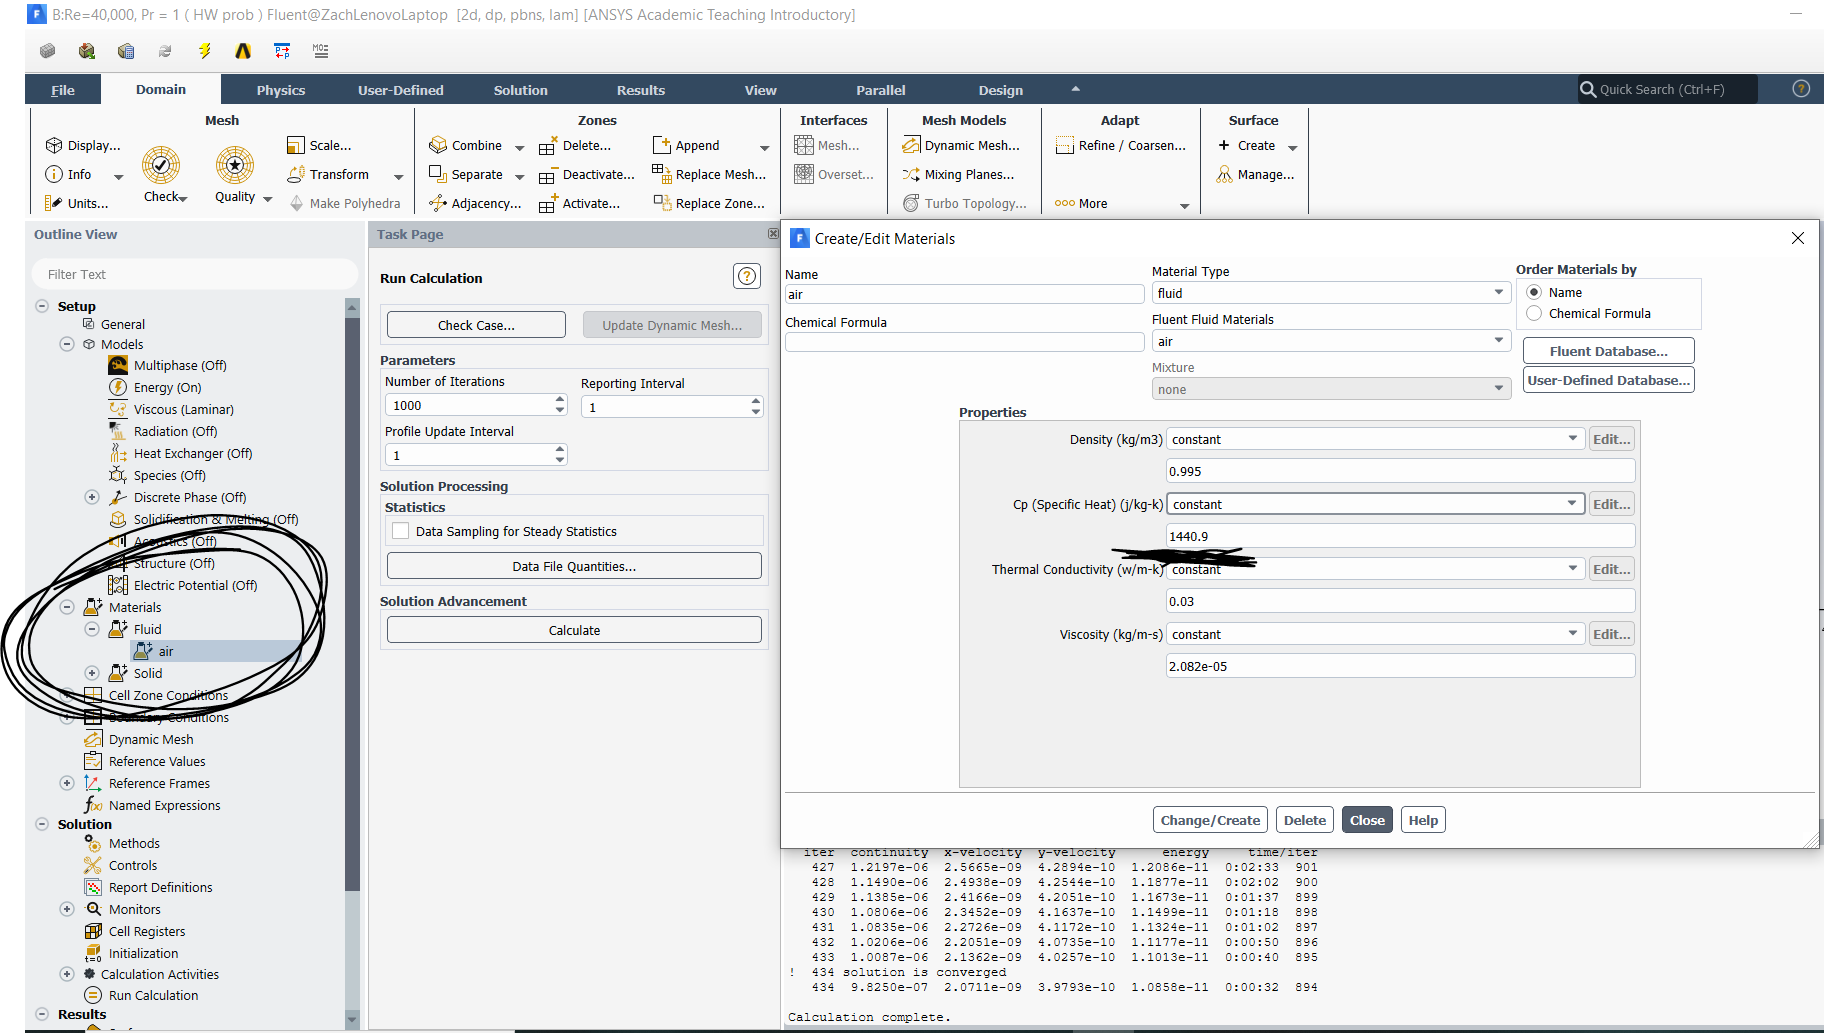
Run more iterations until the you get convergence (when the residuals are below 1e-6). Note you don't need to reinitialize the guess values since the velocity and pressure fields remain the same. Cp affects only the energy equation.
Export Nux Nux vs. Rex Rex to a csv file. Read off the Nux Nux value for Rex Rex = 4010,000. This is the Nux Nux value for the new Pr at that Rex.
Repeat for the other Pr values. Create a list of values in Excel from these runs with the following three columns (you are only changing the Pr number through the Cp of air enough times to notice a trend, 3 data points are not enough to notice a trend but 20 data points might not be the most efficient use of time).
Cp Pr Nux
Plot Nux Nux vs Pr in Excel and add the trend line to get a fit and the exponent m
...