 Sign-up for free online course on ANSYS simulations!
...
| HTML |
|---|
<iframe width="600" height="338" src="https://www.youtube.com/embed/jG_U8UNMg5w" frameborder="0" allowfullscreen></iframe> |
Summary of the above video:
- Right-click on wall_artery → Edit → Render → Change "Transparency" to 0.7
- On the top toolbar, click on the vector icon
- Name it Velocity Vector
- For the Location in the Geometry tab, select fluid_zone
- Click Apply
- Click on the Contours button
- Location → wall_artery
- Under Color tab, choose Variable → Wall Shear
- Click Apply
- Turn off artery_wall
- Under Construction
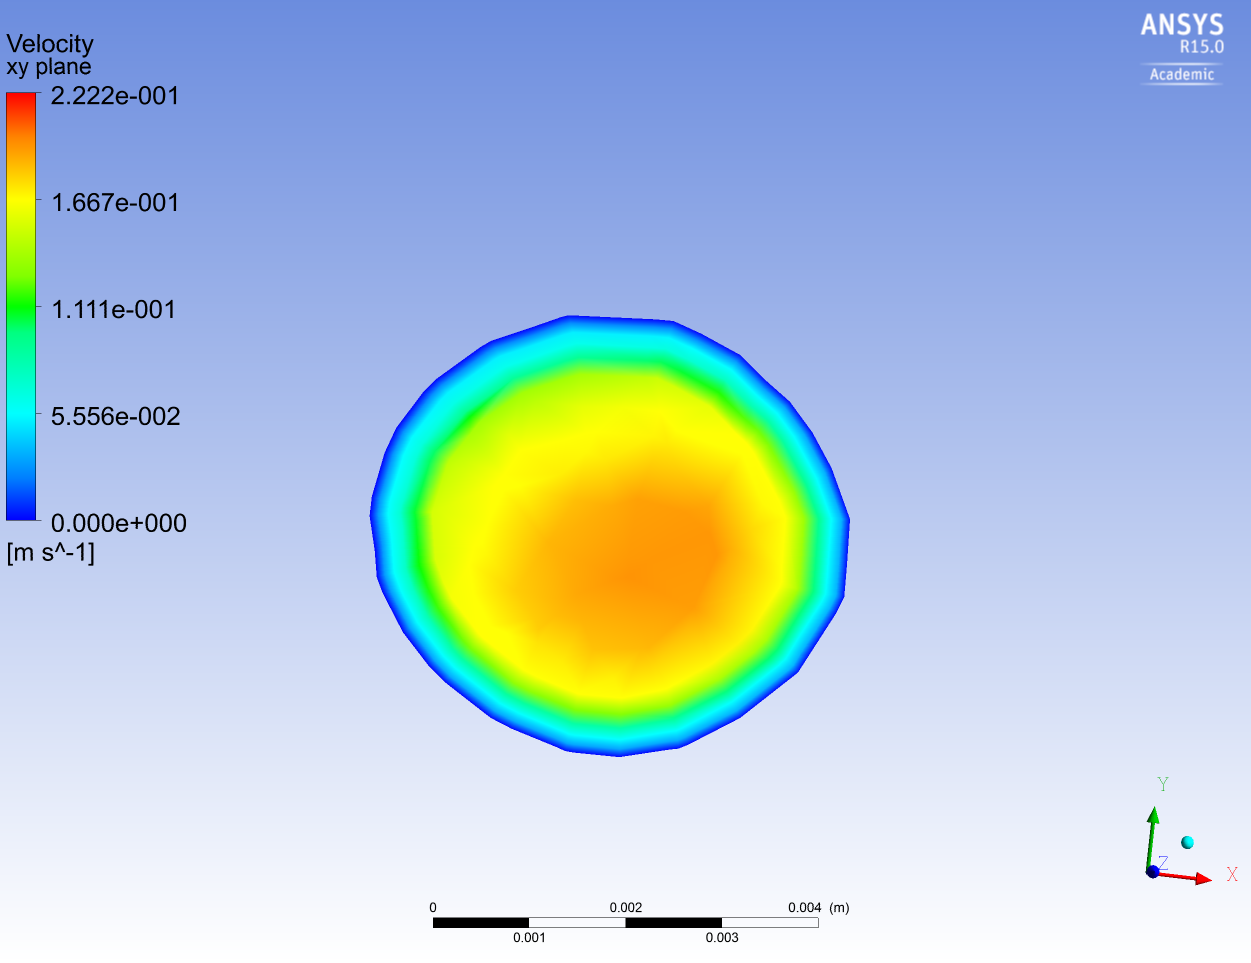
Plot contours at specific locations
Basically, you need to first create a plane, and then color the plane by your desired variable. Methods to create a plane include:
Plane (you can specify three point, or one point and a normal vector), Isosurface (where you can specify x, y or z values), user surface or surface group. After constructing your surface, color it by variable, and choose the variable you would like to plot. Finally, you may toggle your view to face normal to the plane, and then turn of all the 3D faces and wireframe that might disturb your view. Then you can take a snapshot of the contour. Example given below:
Isosurface → variable z → Color by velocity → Turn off the walls and outlets and wireframe
Go to Step 7: Verification & Validation
...