 Sign-up for free online course on ANSYS simulations!
...
Start by double clicking on Response Surface in the Project Schematic window. Once the Response Surface window opens click Update. After, the update has completed click on Response to see a plot of the volume as a function of hole radius.
Note: Don't worry if you are using a newer version of ANSYS and your results don't quite match the results shown here! The goal of this module is simply to teach you how to use the optimization process in ANSYS, not to rigorously find the optimal design for the plate with a hole. If we wanted to do that, we would need to use a much more refined mesh than what we are using here.
Volume
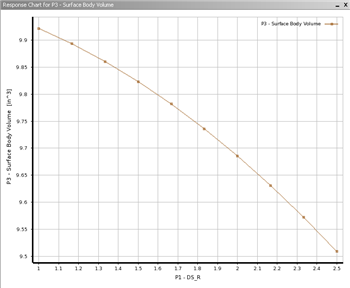
The first plot which should appear shows the volume of the quarter plate as a function of the hole radius, and is shown below.
| newwindow | ||||
|---|---|---|---|---|
| ||||
https://confluence.cornell.edu/download/attachments/131466103/SurBodyVol_Response_Full.png |
The relation between radius and volume is quite trivial to compute. It will simply be the area of the surface multiplied by the thickness of the surface. With this in mind, V=t*(h*w-(1/4)*pi*r^2) where V=volume, t=thickness, h=height, w=width and r=radius.
...