 Sign-up for free online course on ANSYS simulations!
...
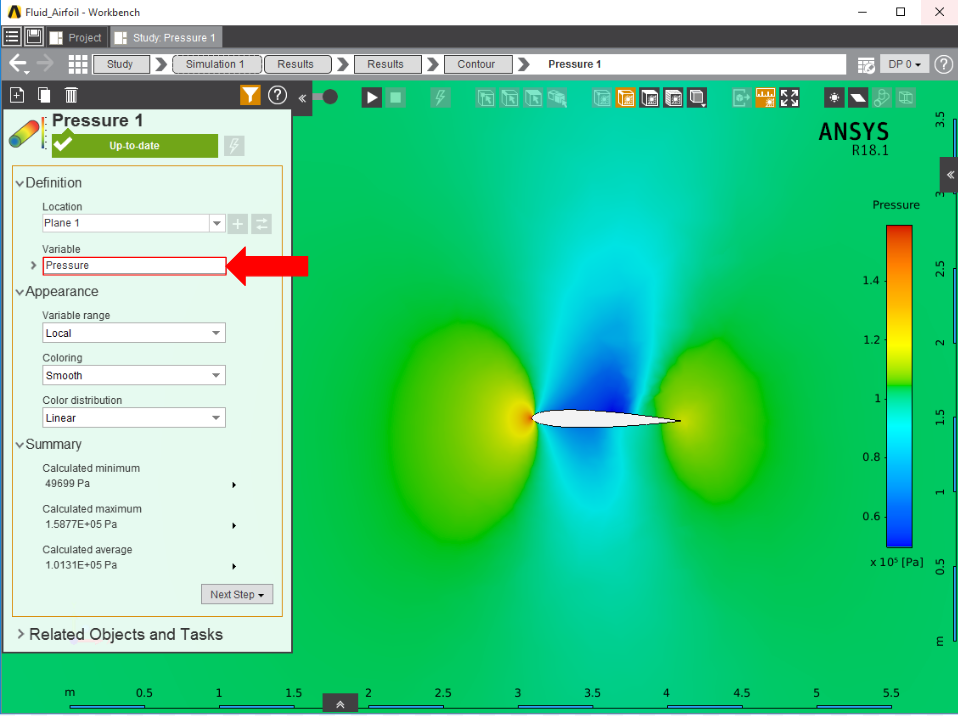
To plot the pressure change, a contour on the side of the flow volume will accurately represent a 2D pressure contour of the flow. Select Contour in the Add drop down menu, select one of the large faces, and assign the Variable to be Pressure.
...
To plot the pressure change, a contour on the side of the flow volume will accurately represent a 2D pressure contour of the flow. Select Contour in the Add drop down menu, select one of the large faces, and assign the Variable to be Pressure.