 Sign-up for free online course on ANSYS simulations!
...
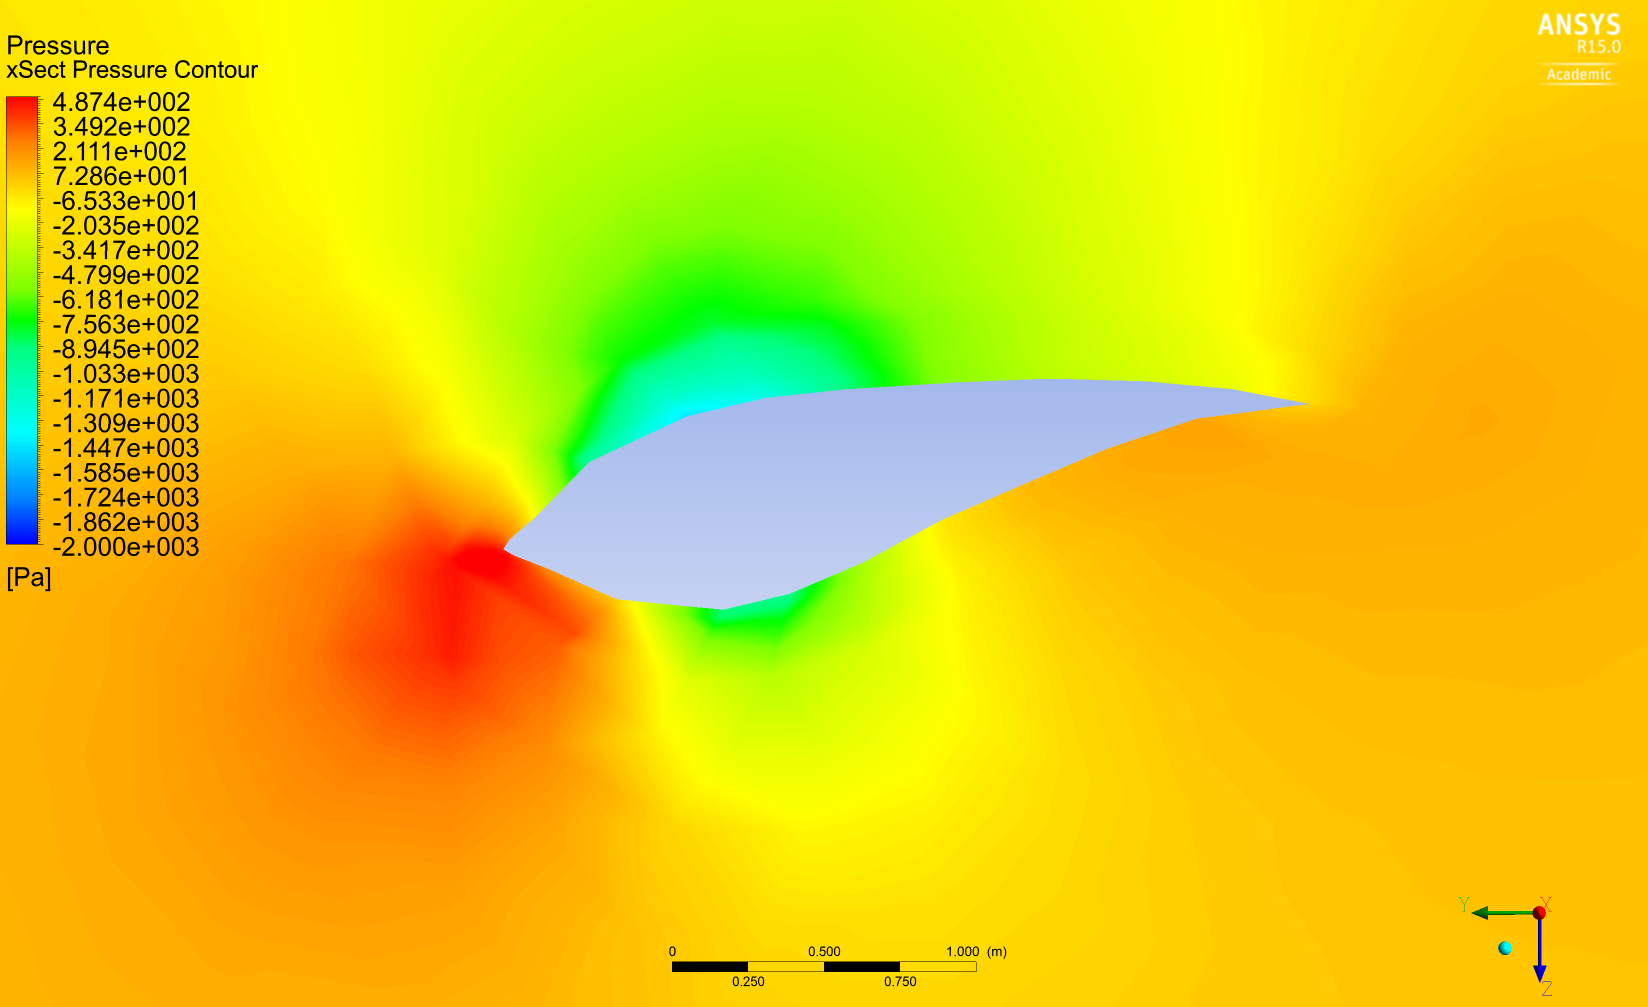
Pressure Contours in the y-z Plane
| HTML |
|---|
<iframe width="640" height="360" src="https://www.youtube.com/embed/wjU8sj7iLeQ?rel=0" frameborder="0" allowfullscreen></iframe> |
Summary of steps in the above videoTo plot the pressure distribution at a cross section of the blade:
- Make sure to have only 1 graphical instance of the blade
- Create a plane
- Select 'Location' > 'Plane'
- Set method to YZ plane
- Set X to desired value (Note that blade is in -x direction)
- Click Apply
- Click +X on the bottom right triad
- Create a pressure contour
- Select 'Insert' > 'Contour'
- Set location to the plane just created
- Make sure the variable is pressure
- Specify min and max values to show high/low pressure regionsGo under the 'view' tab and check 'apply rotation'"local" for range
- Set axis to X Set angle to 90 degrees
...
Pressure Contours along the z-axis
...