 Sign-up for free online course on ANSYS simulations!
...
- Start FLUENT
- Go to File > Data File Quatntities
- Make sure Turbulent Velocity is selected, press OK
- Go back to FLUENT, click on Run Calculation
- Enter 1 in Number of Iterations
- Calculate
- Go back to Project Schematic
- Right click on Results > Refresh
- Go to CFD Post
- Click on Expressions tab
- Right click on Expressions > New
- Name it mut nondim exp
- In Definition white space:
- Right click > Variables > Eddy Viscosity
- Insert + 2e-5[kg/m/s]
- Divide whole thing by molecular viscosity 2e-5[kg/m/s]
- Apply
- Go to Variables tab
- Right click Derived > New
- Name it mut nondim
- Click Expression > select mut nondim exp
- Go to Outline > click on Chart icon in top toolbar
- Name it mut nondim plot
- Click on Data series
- Location Pipe Outlet
- Click on X Axis
- Variable mut nondim
- Click on Y Axis
- Variable r nondim
- Apply
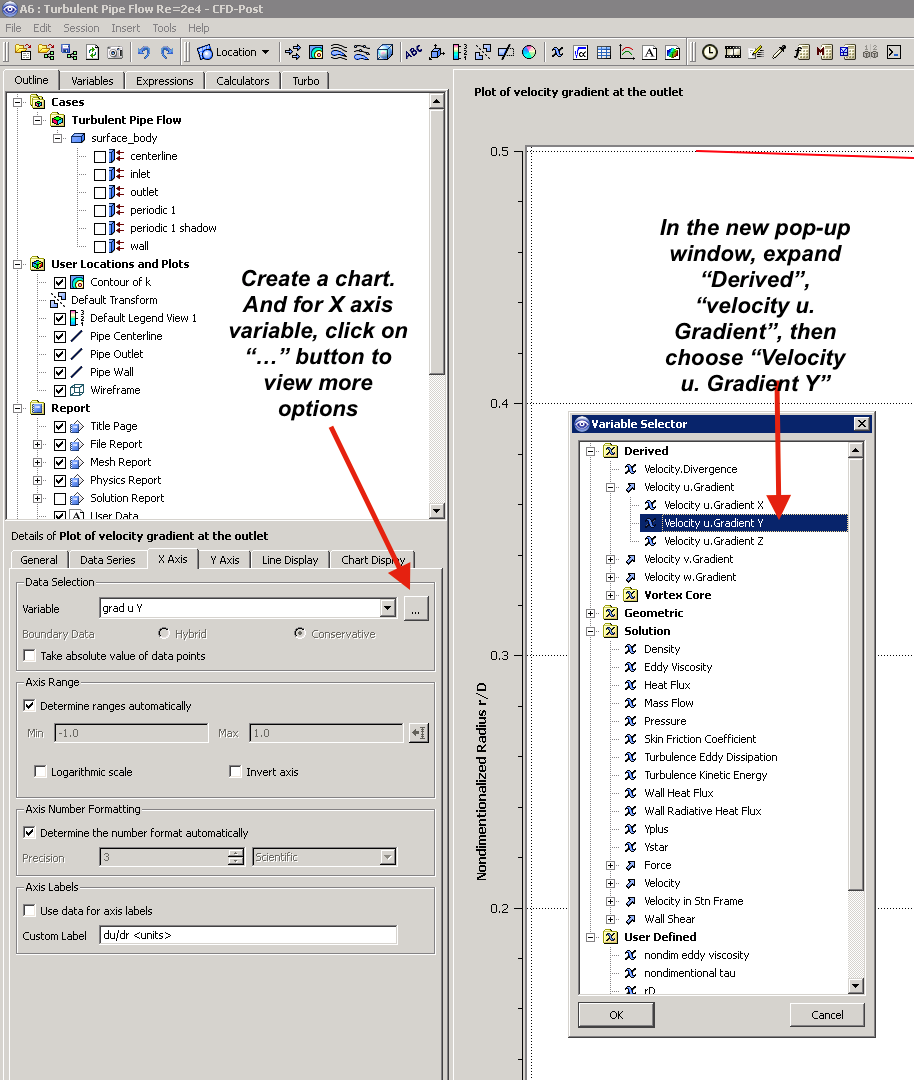
Tips on plotting additional derived quantities (such as velocity gradient)
In order to plot additional derived quantities such as the gradient, divergence or curl of the velocity field, you may find these quantities in a pop-up window in CFD post. Look at the illustration below for plotting velocity gradient in x.
Go to Step 7: Verification & Validation
...