 Sign-up for free online course on ANSYS simulations!
| Include Page | ||||
|---|---|---|---|---|
|
| Include Page | ||||
|---|---|---|---|---|
|
Response Surface
...
Start by double clicking on Response Surface in the Project Schematic window. Once the Response Surface window opens click Update. After, the update has completed click on Response to see a plot of the volume as a function of hole radius.
...
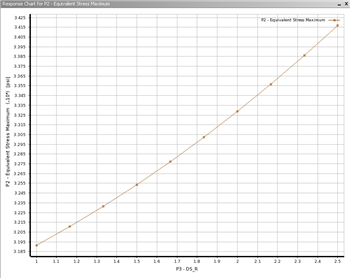
In order to display a plot of the maximum von Mises stress as a function of the hole radius, change the value assigned to Y axis to P3-Equivalent (von-Mises) Stress Maximum. The plot below shows the maximum Von Mises stress as a function of the hole radius.
...
As expected, the maximum Von Mises Stress increases as the radius increases. You can use this graph to get an idea of what radius might constitute the upper limit in accordance with our constraint of 32.5 ksi. Remember that to minimize volume, you want the greatest radius possible that still creates an equivalent Von Mises stress under our constraint. Taking a close look will tell you that you should expect an optimal radius of around 1.5 inches.
At this point, click Return To Project and then save the project.
...