Sign-up for free online course on ANSYS simulations!
| Include Page | ||||
|---|---|---|---|---|
|
| Include Page | ||||
|---|---|---|---|---|
|
Step 6: Numerical Results
Total Deformation
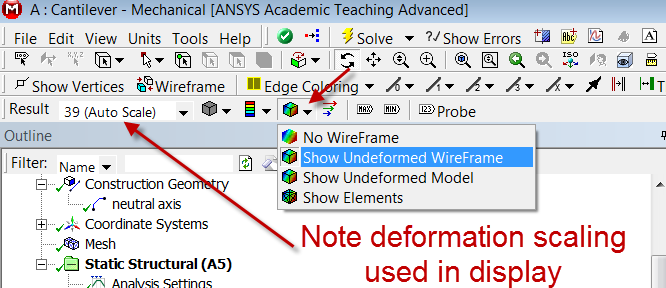
First, examine the total deformation by clicking on the Total Deformation object  in the tree. Turn on the Undeformed Wireframe as shown below.
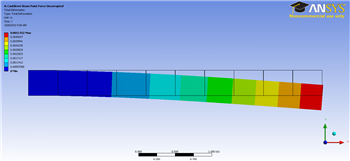
With 10 line elements, you should see the following output for the total deformation.
| newwindow | ||||
|---|---|---|---|---|
| ||||
| Wiki Markup | ||||
{include: Cantilever Beam - Panel} {include: ANSYS Google Analytics} h2. Step 6: Numerical Results h4. Total Deformation First, examine the total deformation by clicking on the Total Deformation object !Totaldeform.png! in the tree. Turn on the _Undeformed Wireframe_ as shown below. \\ \\ [!beam_def.png|width=350!|^beam_def.png]\\ \\ \\ With 10 line elements, you should see the following output for the total deformation. !10ElemDefCornellian_350.png! {newwindow:Click Here for Higher Resolution}https://confluence.cornell.edu/download/attachments/125812731/10ElemTotDefCornellian_full.png{newwindow} \\ If you turn off _View > Thick Shells and Beams_, you will see the deformation of the line elements. The 3D beam view is constructed from this. The maximum deformation is 0.0051 m which matches the hand-calculation value from the [Pre-Analysis|SIMULATION:Cantilever Beam - Pre-Analysis & Start-Up]. When ANSYS displays the beam deformation, it just connects the displacements at nodes by straight lines. The display ignores the fact that the we also have the slope at the nodes. So you'll see an unphysical-looking jagged line in the deformation display. This is a shortcoming of the _display_, not of the underlying beam element formulation. You'll see the displayed deformed shape getting smoother as you refine the mesh. The beam deformation can be animated by clicking on the play button, !playbutton.png!, which is located underneath the beam deformation results. This will interpolate between the initial undeformed and final deformed configurations. \\ \\ h4. Maximum Bending Stress In order to examine the maximum bending stress first expand the Beam Tool folder, !BeamTool.png!, which is located under |
If you turn off View > Thick Shells and Beams, you will see the deformation of the line elements. The 3D beam view is constructed from this. The maximum deformation is 0.0051 m which matches the hand-calculation value from the Pre-Analysis.
When ANSYS displays the beam deformation, it just connects the displacements at nodes by straight lines. The display ignores the fact that the we also have the slope at the nodes. So you'll see an unphysical-looking jagged line in the deformation display. This is a shortcoming of the display, not of the underlying beam element formulation. You'll see the displayed deformed shape getting smoother as you refine the mesh.
The beam deformation can be animated by clicking on the play button,  , which is located underneath the beam deformation results. This will interpolate between the initial undeformed and final deformed configurations.
Maximum Bending Stress
In order to examine the maximum bending stress first expand the Beam Tool folder,  , which is located under "Solution(A6)".
...
Next,
...
click
...
on
...
the
...
Maximum
...
Bending
...
Stress
...
button,
...

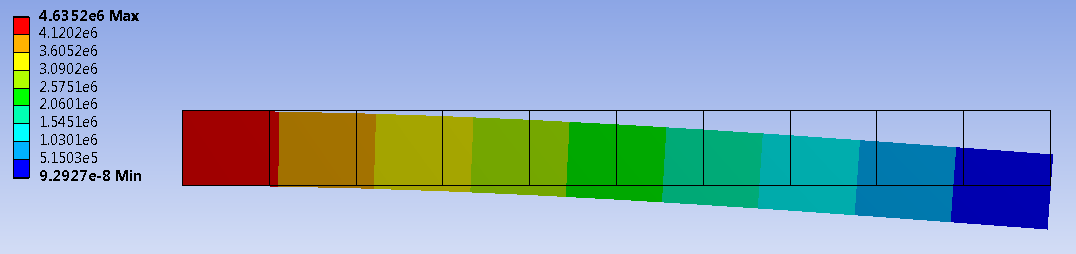
Note that in this display, ANSYS shows the same value across the cross-section.
...
This
...
visualization
...
is
...
misleading.
...
The
...
maximum
...
bending
...
stress
...
occurs
...
only
...
at
...
the
...
top
...
fiber.
...
The
...
value
...
that
...
ANSYS
...
reports
...
is
...
4.635
...
MPa
...
which
...
matches
...
the
...
value
...
from
...
the
...
Pre-Analysis exactly.
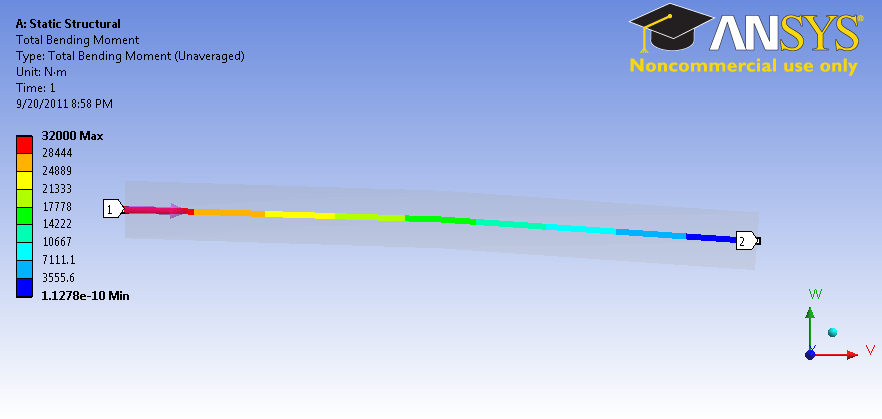
Bending Moment
To view the bending moment along the beam, click Total Bending Moment in the Outline window. You should see the following in the graphics window.
| newwindow | ||||
|---|---|---|---|---|
| ||||
|SIMULATION:Cantilever Beam - Pre-Analysis & Start-Up] exactly. h3. Bending Moment To view the bending moment along the beam, click {color:purple}{*}{_}Total Bending Moment{_}{*}{color} in the _Outline_ window. You should see the following in the graphics window. !BendingMoment.png|width=350! {newwindow:Click here to enlarge}https://confluence.cornell.edu/download/attachments/125812731/BendingMoment.png?version=1&modificationDate=1316567309000{newwindow} |
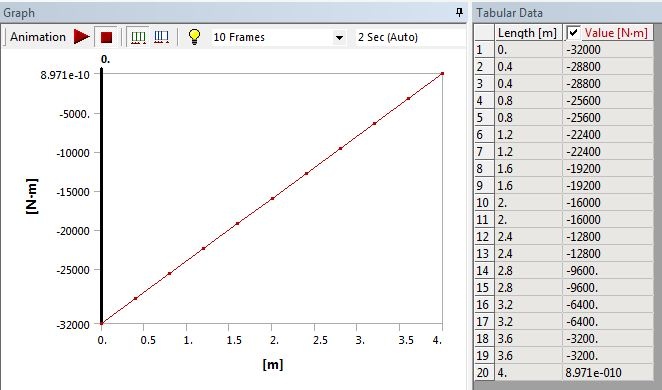
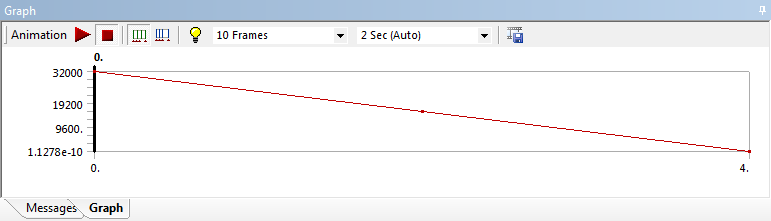
Also
...
notice
...
that
...
the
...
values
...
were
...
plotted
...
in
...
a
...
graph
...
in
...
the
...
Graph
...
window
...
and
...
also
...
displayed
...
in
...
a
...
table.
...
The
...
values
...
can
...
be
...
exported
...
into
...
a
...
Excel
...
or
...
text
...
file
...
by
...
right-clicking
...
on
...
the
...
table.
| newwindow | ||||
|---|---|---|---|---|
| ||||
!Graph.png|width=350! {newwindow:Click here to enlarge}https://confluence.cornell.edu/download/attachments/125812731/Graph.png?version=1&modificationDate=1316567430000{newwindow} |
In
...
the
...
above,
...
pay
...
close
...
attention
...
to
...
maximum
...
and
...
minimum
...
values
...
of
...
the
...
bending
...
moment.
...
At
...
the
...
left
...
end,
...
the
...
bending
...
moment
...
is
...
32000
...
Nm;
...
the
...
calculation
...
for
...
moment is
| Wiki Markup |
|---|
is {latex} $ M = F \times d = (8000 N) \times (4 m) = 32000 \mbox{ Nm} $ {latex} |
So
...
this
...
checks
...
out.
...
We
...
also
...
notice
...
that
...
the
...
minimum
...
moment
...
1.1278E-10
...
Nm.
...
Because
...
this
...
value
...
is
...
over
...
1E-14
...
smaller
...
that
...
the
...
largest
...
value,
...
it
...
can
...
be
...
assumed
...
to
...
be
...
zero
...
to
...
machine
...
precision.
...
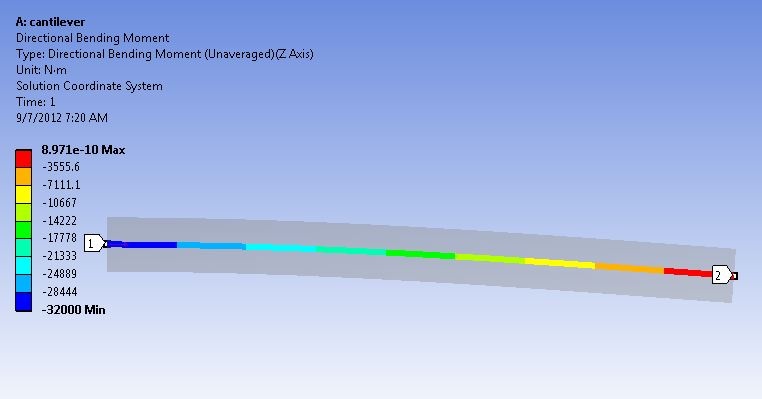
Directional Bending Moment
To view the directional bending moment along the beam, click Directional Bending Moment in the Outline window. You should see the following in the graphics window. The Directional Bending Moment gives us the sign along with the magnitude.