 Sign-up for free online course on ANSYS simulations!
...
To do this, click the Contour button at the top menu 
In the pop up dialogue box, name the contour after the variable that it will display and press OK. For all contour plots, select "periodic 1" for the location, and increase the number of contours to 51. Change the drop down box under Variable to the variable that you would like to create the contour of. Press "Apply" to generate the contour, and repeat this process for all contours.
Stream Function: 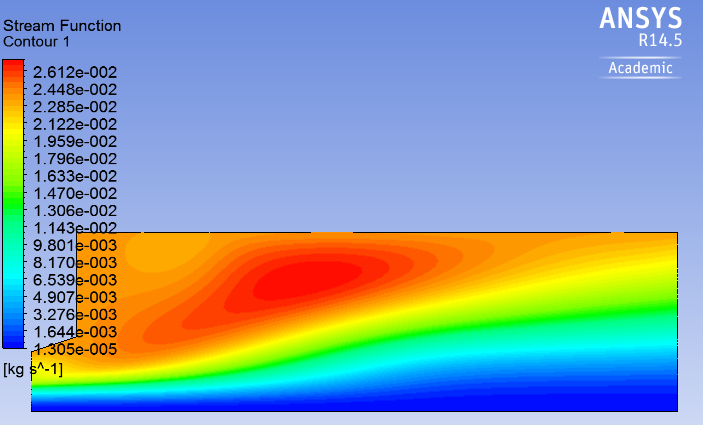
Progress Variable: 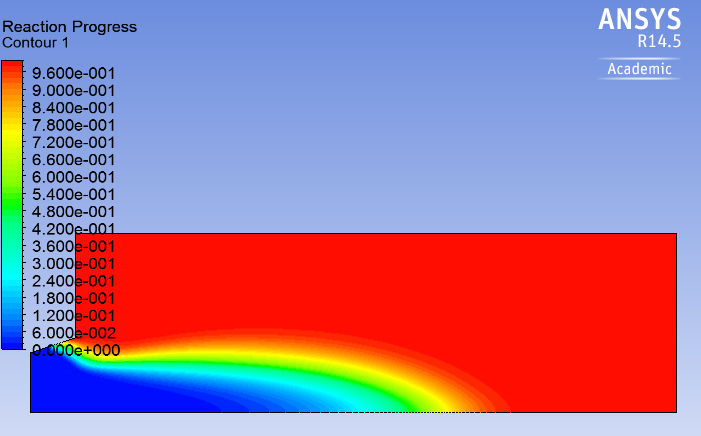
Temperature: 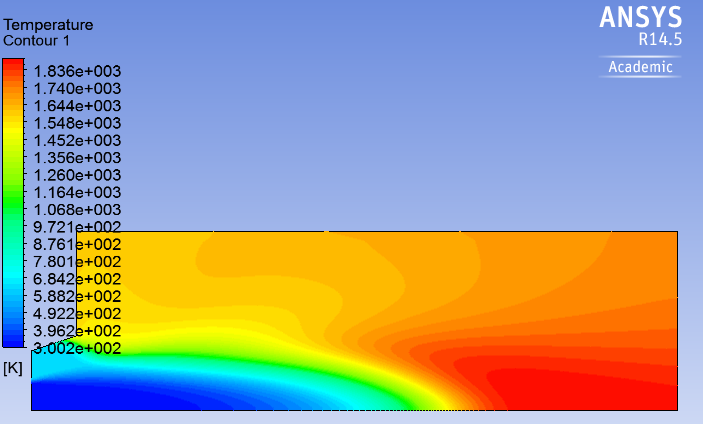
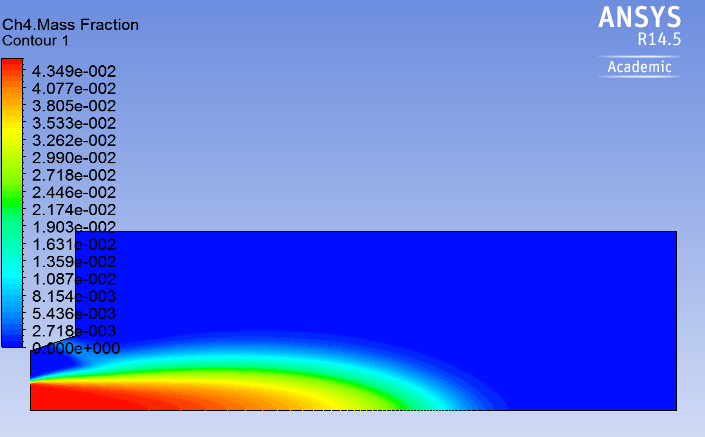
Mass Fraction of CH4:
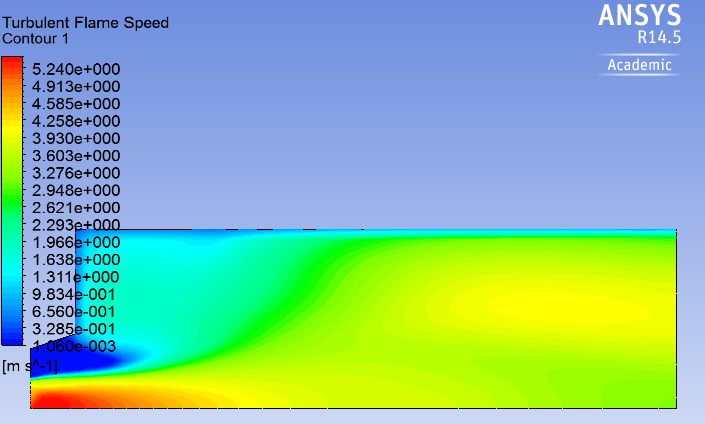
Turbulent Flame Speed:
Go to Verification & Validation
...