 Sign-up for free online course on ANSYS simulations!
...
| Include Page | ||||
|---|---|---|---|---|
|
Numerical Results
Velocity Vectors
First, let's take a look at the velocity vectors. In the Outline window, under Results select Colors and Animations. In the Colors and Animations window, under Graphics, select Vectors. Then press Set Up....
In the Vectors window that opens, change the Scale of the arrows to 0.25, and change the Color by parameter to Velocity... Mach Number

Hit Display to view the vectors in the graphics window
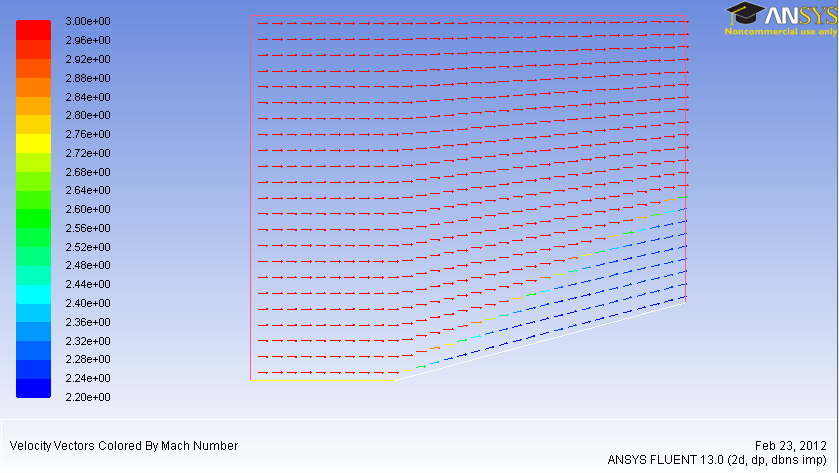
Once you have plotted the velocity vectors, you may close the Vectors menu.
Mach Number Contours
Next, we will plot the contours of mach number. In the Graphics and Animations window under _Graphics, select Contours, and press Set Up.... Change the Contours Of parameter to Velocity... Mach Number. Next, check the box next to Filled.

Change the Levels to 50 and press Display
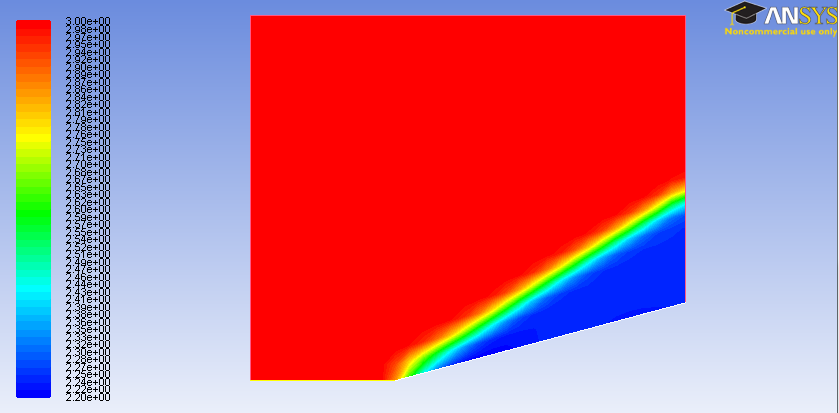
Next, click on print information icon  , and click anywhere behind the shock. This will display a range of values. For instance, I received (2.2354529, 2.2513809). These range of values match well with the analytic solution we received in the pre-anaysis (Mach no. = 2.254, 0.8% difference)
Pressure Coefficient/ Static Pressure Contours
Now, change the Contours Of parameter to Pressure... Pressure Coefficient and press Display.

Next, change the Contours Of parameter to Pressure... Static Pressure and press Display. When you have plotted the contours of static pressure, you may close the Contours window. Again, use the print information tool to view the pressure behind the shock. I received the range (282041.19, 286057.13). The average of this range is about 2.803 atmospheres. From the analytical solution, we found that the pressure behind the shock is about 2.824, a 0.7% difference.
Pressure Coefficient Along Wedge
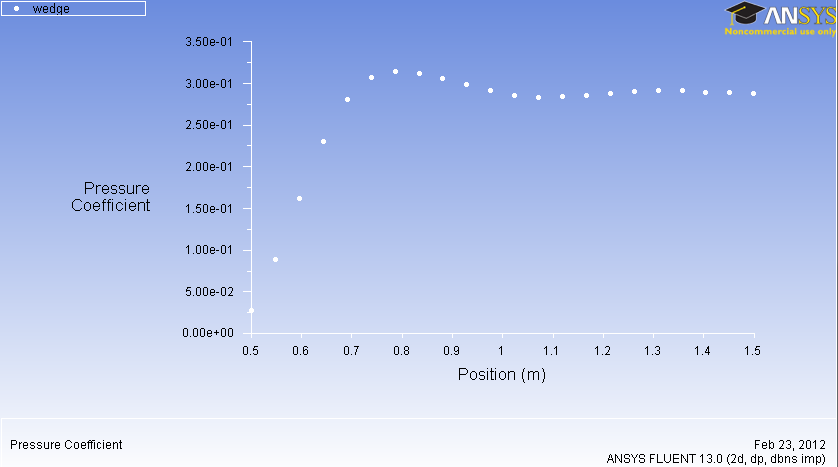
In the Outline window under Results, select Plots. In the Plots window, select XY plot and press Set Up.... Change the Y Axis Function to Pressure... Pressure Coefficient, and select the Wedge under Surfaces.

To see the plot, press Plot
Measure Shock Angle
To measure the shock angle, we first need to create a line that we can plot the coefficient of pressure over. In the Solution XY Plot window, click New Surface > Line/Rake. We will arbitrarily use the line, y = 0.35. Set the start point of the line as (0,0.35), and the end point of the line as (1.5,0.35). Name the line y = 0.35. Now press Create

Now, the new surface will appear in the list of surfaces. We want to plot the pressure coefficient across the wedge and the new line we created in order to determine the shock angle. In the list of surfaces, select wedge, symmetry, and y = 0.35. Press Plot.
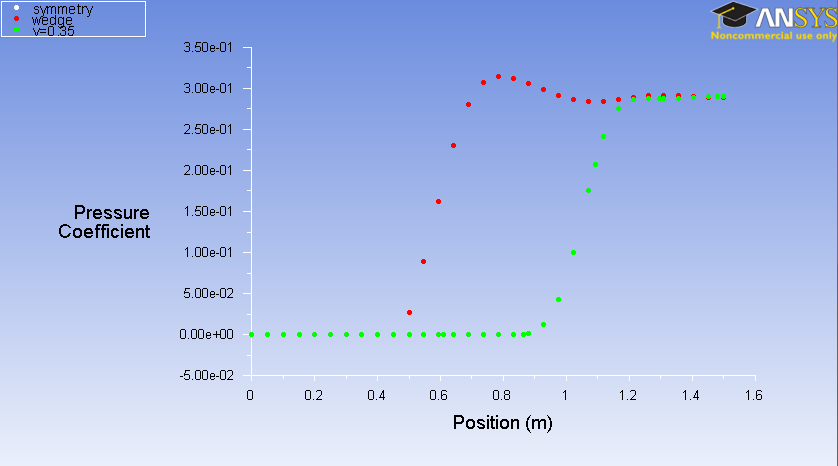
We can then use the information from the plot to solve for the shock angle.

The shock angle from the analytical solution was 32.221 degrees. Because we took the value from a graph, a bit more error is to be expected.
Print Drag Coefficient
...
Mach Number Contours
The following video shows how to make a plot of the Mach number contours using CFD Post, the CFD post-processor included with ANSYS Workbench.
| HTML |
|---|
<iframe width="600" height="338" src="//www.youtube.com/embed/cZpjpNbxXYM" frameborder="0" allowfullscreen></iframe> |
Pressure Contours
The following video shows how to make a plot of the pressure contours.
| HTML |
|---|
<iframe width="600" height="338" src="//www.youtube.com/embed/uPfpFds_JpQ" frameborder="0" allowfullscreen></iframe></iframe> |
Velocity Vectors
To plot the velocity vectors, follow the steps in the video below.
| HTML |
|---|
<iframe width="600" height="450" src="//www.youtube.com/embed/sTm_G4W7ujQ" frameborder="0" allowfullscreen></iframe> |
Plot Mach Number Variation Along y=0.4 m
First, we'll create a line at y=0.4m. Then, we'll plot the Mach number variation along this line using the "Chart" facility in CFD Post. These steps are shown in the video below.
| HTML |
|---|
...
Go to Step 7: Verification & Validation
...