 Sign-up for free online course on ANSYS simulations!
...
Verification and validation is a formal process for checking results. Each of these terms has a specific meaning which we won't get into here. We'll act like high-priced consultants and do the bare minimum: we'll refine the mesh and make sure that the results are nearly independent of the mesh. We will also repeat the comparison with experiment which is a very important way to check simulation
| Info | ||
|---|---|---|
| ||
Comparison with the experimental measurements is another way you'll check the FLUENT results. |
Refine Mesh
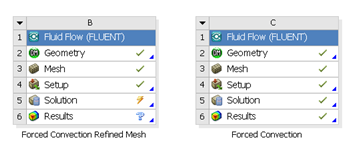
Let's repeat the solution on a finer mesh with smaller cells. In workbench, under Forced Convection project, right click on Fluid Flow (FLUENT) and click duplicate. Rename the duplicate project to Force Convection Refined Mesh. You should have two project cells in workbench.
...
Highlight "Edge Sizing 2". Under Details of "Edge Sizing 2", decrease element size Element Size to be 0.02. This will refine the mesh in the axial direction.
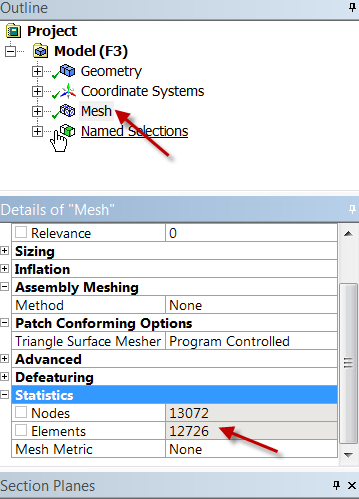
Click Update  to generate the new mesh. If you refer back to the mesh details highlight Mesh in the tree and expand statisticsStatistics, you will notice that the number of elements has increased to 15300about 12,800, compared to 5508 of the original mesh.

Close the ANSYS Mesher and go back to Workbench windowswindow. Under Forced Convection Refined Mesh, right click on Fluid Flow (FLUENT) and click Update. Wait for a few minutes for FLUENT to obtain a solution on the new mesh and update all the results.
We would want to compare the solution on the two meshes. To do that, drag the Solution cell of Forced Convection Refined Mesh to Results cell of Forced Convection.

Finally, double click on Results cell of Forced Convection to compare . Under Outline tab, click on the results of interest to analyze the results on the two meshes. Select the Chart Viewer tab near the bottom of the graphics window. Double-click on Centerline Temperature in the Tree view to see the updated results (pretty sweet, huh?).
Centerline Temperature

...
https://confluence.cornell.edu/download/attachments/111221577/CenterlineTempComparison.png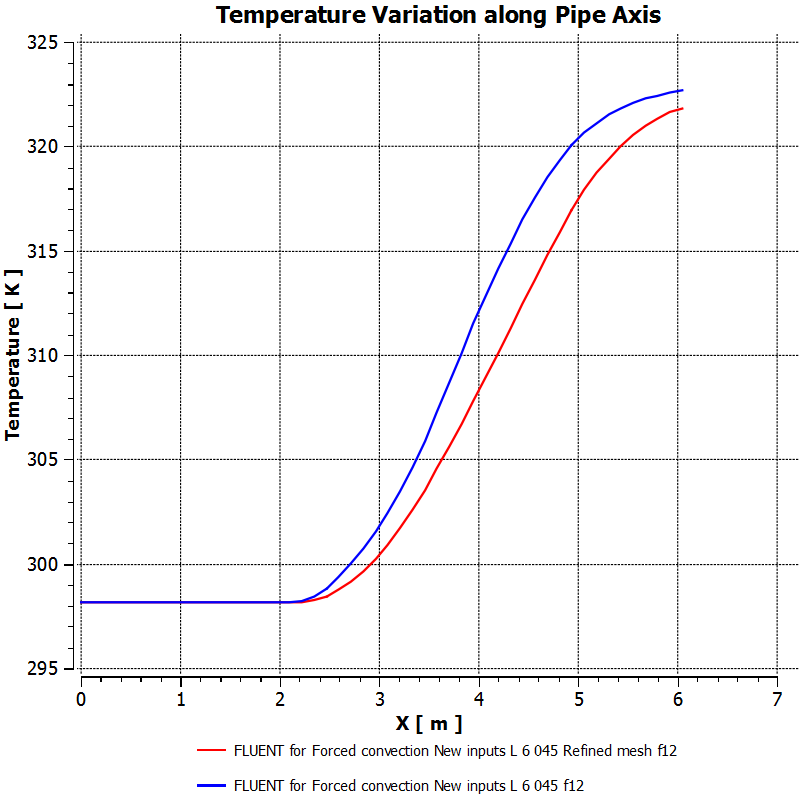
The red line corresponds to the refined mesh. Similarly, one can check wall temperature variation on the two meshes.

Refining the mesh doesn't change the wall temperature much but the centerline temperature changes a fair bit. So another level of mesh refinement would be wise
Wall Temperature

...
https://confluence.cornell.edu/download/attachments/111221577/WallTempComparison.PNGAxial Pressure

...
https://confluence.cornell.edu/download/attachments/111221577/AxialPressComparison.pngFirst Section Axial Velocity Profile

...
https://confluence.cornell.edu/download/attachments/111221577/FirstVelocityComparison.PNGSecond Section Axial Velocity Profile

...
https://confluence.cornell.edu/download/attachments/111221577/SecondVelocityComparison.PNGTemperature Profile

...
https://confluence.cornell.edu/download/attachments/111221577/TemperatureProfileComparison.PNGComparison of Results
We can see from the charts comparing the results from the original and refined meshes that the results have changed very little and still compare well with actual simulation results. From this, we can say that our results have mesh-converged, refining the mesh further will not improve results.
See and rate the complete Learning Module
...