| Include Page |
|---|
| SIMULATION: Stepped Shaft T-Beam - PanelSIMULATION: Stepped Shaft |
|---|
| T-Beam - Panel |
|---|
|
| Include Page |
|---|
| SIMULATION: ANSYS Google AnalyticsSIMULATION: |
|---|
| ANSYS Google Analytics |
|---|
|
...
Numerical Results
The following video shows Here is how to plot the deformed shape and use it to check if the boundary conditions (displacement constraints and point load) have been applied correctly.
| Widget Connector |
|---|
| width | 600 |
|---|
| url | http://www.youtube.com/watch?v=elWidnBtGAE |
|---|
| height | 370 |
|---|
|
The following video shows how to plot the normal stress in the axial direction. The stress concentration factor can be deduced from this plot.
| Widget Connector |
|---|
| width | 600 |
|---|
| url | http://www.youtube.com/watch?v=UoTaAUUKyGE |
|---|
| height | 370 |
|---|
|
...
Right-click on solution, mouse over insert, then stress and select normal. Change the orientation to the z-axis because this is the direction of axial stress for our beam. And finally, click on the solve button. Your result should be very similar to the following figure. Notice the bent shape of our beam. This is exactly what we expect from our boundary conditions.
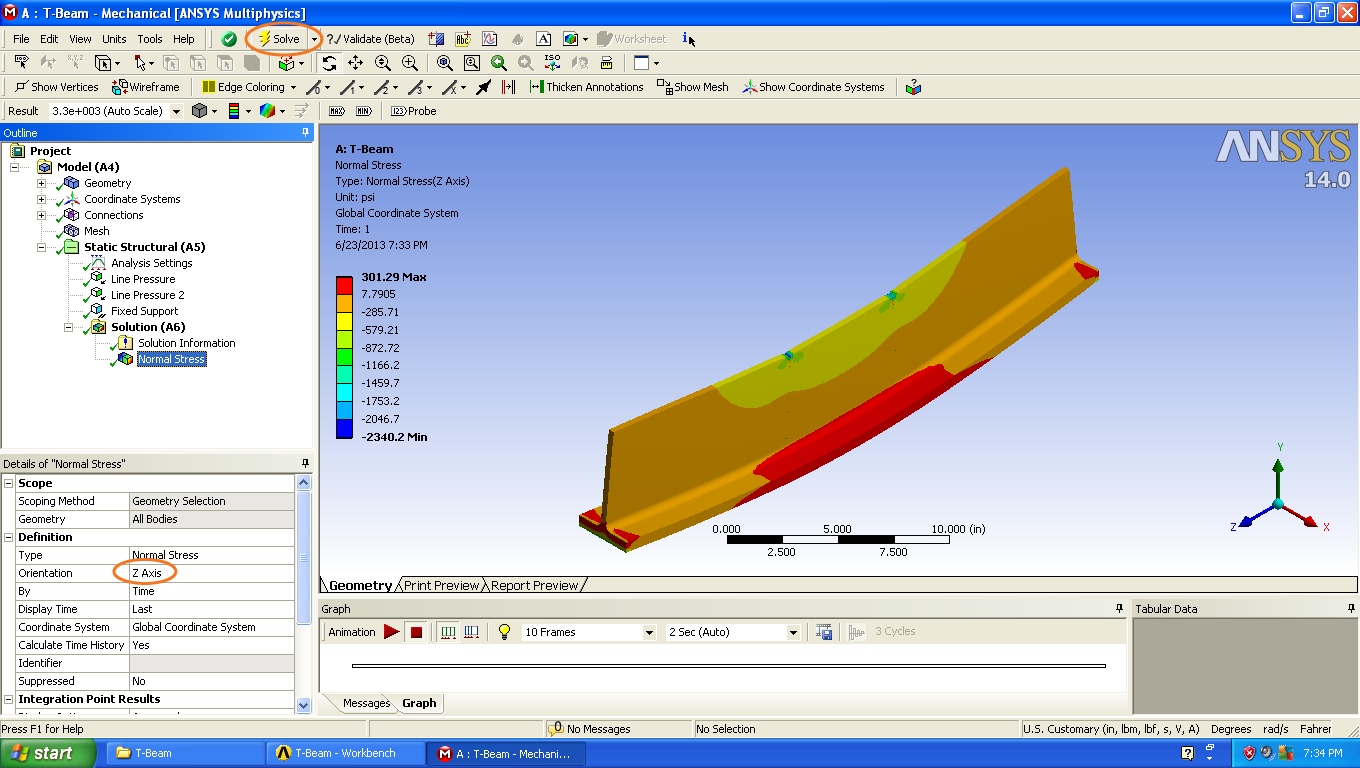 Image Added
Go to Step 7:
| Widget Connector |
|---|
| width | 600 |
|---|
| url | http://www.youtube.com/watch?v=_cvqjodZH7A |
|---|
| height | 370 |
|---|
|
Continue to Step 7 - Verification and Validation
Go to all ANSYS Learning Modules
 Sign-up for free online course on ANSYS simulations!