 Sign-up for free online course on ANSYS simulations!
...
To get back the color contours of deformation values, select the Contours button and choose Contour Bands. The colored section refers to the magnitude of the deformation (in inches) while the black outline is the undeformed geometry superimposed over the deformed model. The more red a section is, the more it has deformed while the more blue a section is, the less it has deformed. Notice that far from the hole, the deformation is linearly varying, similar to a bar in tension. Now let's look at the value of the largest deformation. Looking at the top of the color bar, we see that the largest deformation is 0.17605 176 inches. From our pre-analysis, we found estimated that the deformation was ~ 0.1724 17 inches - a 2% difference. Being that our calculation was only an estimate (we neglected the hole), this seems reasonableThis is one check on our ANSYS result.
Save Image to File
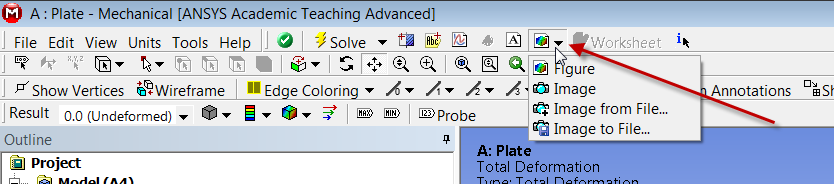
You can save the image to a file using the Image to File option shown below.
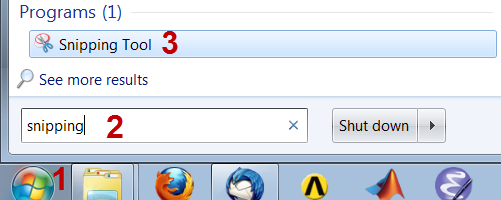
Sometimes, you get an error saying ""The display settings are Windows Aero and image capture might not work." In that case, you can use the Windows 7 snipping tool which can be accessed from the Start > Programs as shown below.
Draw a rectangle around the screen area that you want to capture and save to an image file.
Sigma-r
Now let's look at the radial stresses in the plate. Look to the outline window and click Solution > Sigma-r. This will display the radial stresses.
...