 Sign-up for free online course on ANSYS simulations!
...
Okay! Now let's look at the numerical solution to the boundary value problem as calculated by ANSYS. Let's start by examining how the plate deformed under the load. Before you start, make sure the software is working in the same units you are by looking to the menu bar and selecting Units > US Customary (in, lbm, lbf, F, s, V, A). Also, select the pan tool by clicking the pan button  from the top bar. This will allow you to zoom by scrolling the mouse wheel, and move the image by left-clicking and dragging.
Now, look at the Outline window, and select Solution > Total Deformation. First, we will look at just the deformation of the plate, without contours. To do this, select the Contours button,  , and select Solid Fill.
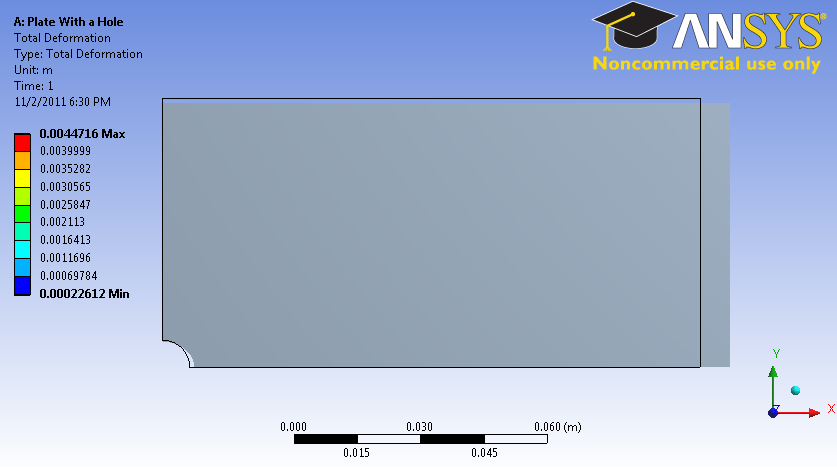
There are a few things we can determine from this picture. Let's use our intuition and the work we did in the pre-analysis to compare to the result ANSYS gives us. First, let's look at the bottom and left edges of the plate. We can see that the deformation on these edges is parallel to the sides, which agrees with the symmetry boundary condition. The top edge of the plate has deformed downwards, which is due to the effects of Poisson's ratio. The right edge has moved to the right, which is consistent with the expected behavior, due to the plate being in tension. So we can deduce the following boundary conditions from looking at the deformation.
...