 Sign-up for free online course on ANSYS simulations!
...
In the Details of Outlet panel, enter the coordinates of the top and bottom vertex at the outletfollowing coordinates. Change the number of samples to 50. Click on Apply to create a line at the outlet.
...
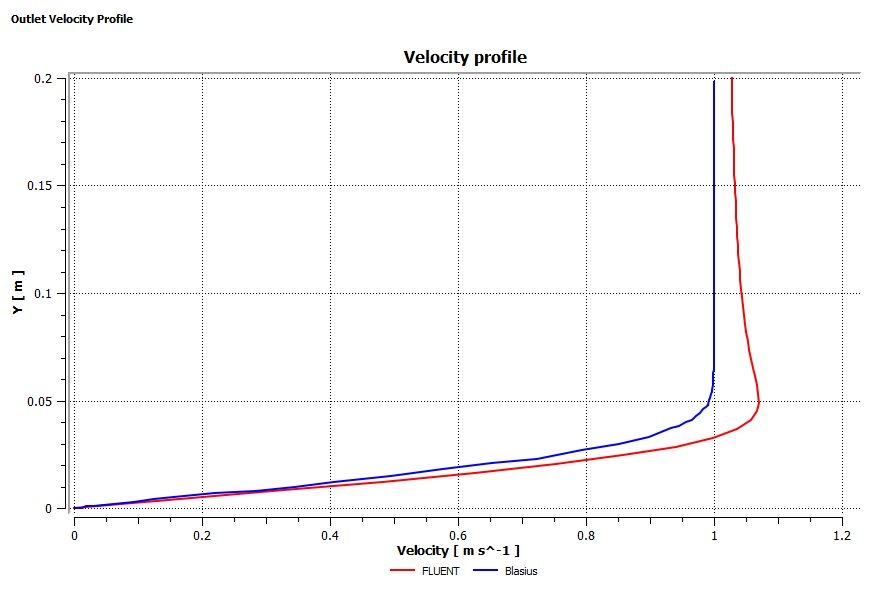
Click on Apply. The comparison should look like the following plot:
Mid-Section Velocity Profile
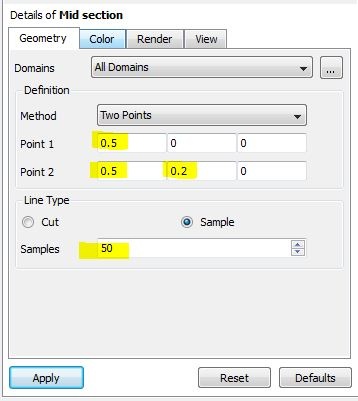
Here, we will plot the variation of the x component of the velocity along a vertical line in the middle of the geometry. In order to create the profile, we must first create a vertical line at x=0.5m. Insert another line, same as the previous step, and name it Mid section. Enter the following numbers to create a vertical line at x=0.5m. Set the number of samples to 50. Remember to click on Apply to finish.
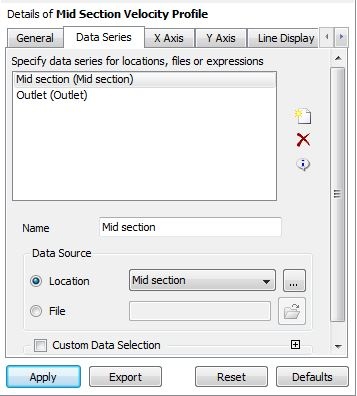
Insert another chart and name it Mid Section Velocity Profile. In the General tab, change the title to "Velocity profile". Select Mid Section as the location and rename Series 1 to Mid section. We will compare the velocity profiles at the mid section and at the outlet. Repeat the procedure in the previous step to insert the velocity profile at the outlet. Change the variable to Velocity in the X Axis tab and change the variable to Y in the Y Axis tab. Click on Apply to generate the chart.
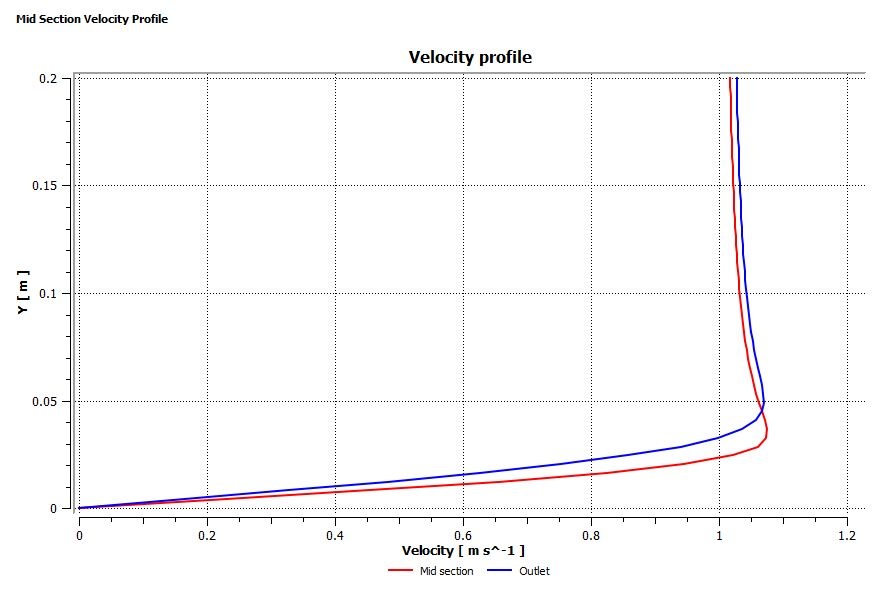
The velocity profile comparison is shown below:
Go to Step 7: Verification & Validation
...