 Sign-up for free online course on ANSYS simulations!
...
You can use the wheel button of the mouse to zoom into the region that closely surrounds the plate, to get a better view of the boundary layer velocities:
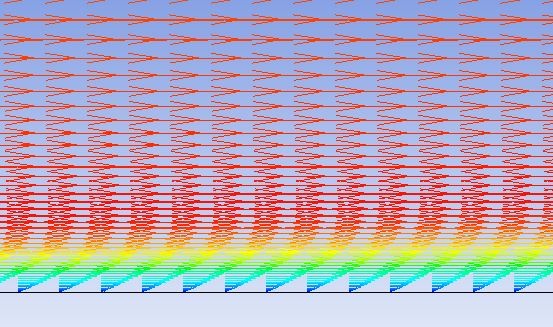
Outlet Velocity Profile
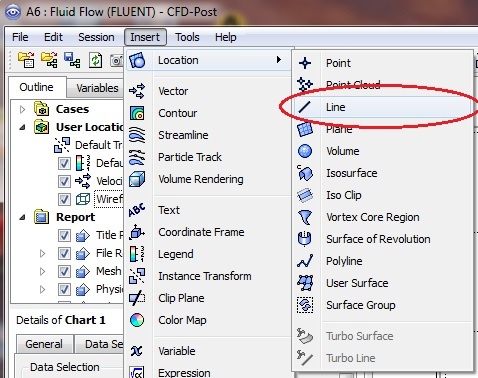
From the menu, insert > location > line. Name it "Outlet"
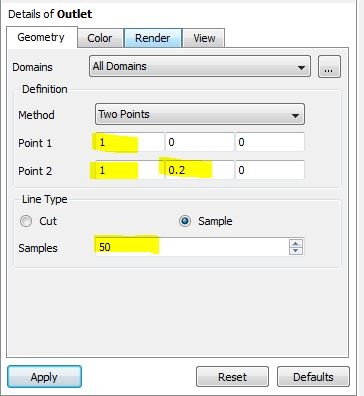
In the Details of Outlet panel, enter the coordinates of the top and bottom vertex at the outlet. Change the number of samples to 50. Click on Apply to create a line at the outlet.
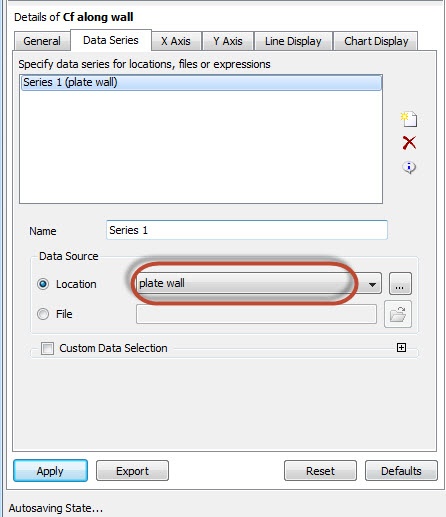
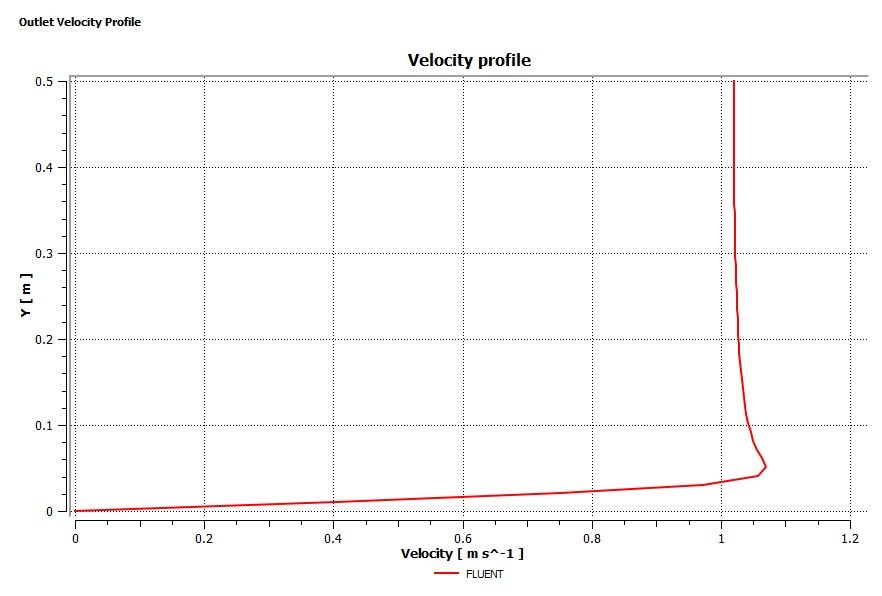
Insert a chart from the menu: insert > chart. Name the chart "Outlet Velocity Profile". Change the title to "Velocity Profile" in the General tab. In the Data Series tab, rename Series 1 to FLUENT and select Outlet for location. Select Velocity as the variable in the X Axis tab and select Y as the variable in the Y Axis tab. Click on Apply to generate the chart.
The velocity profile at the outlet is shown below:
Go to Step 7: Verification & Validation