 Sign-up for free online course on ANSYS simulations!
...
Then set X Min to 0.5 m, set X Max to 32 m, set Y Min to 0 m, and set Y Max to 32m.
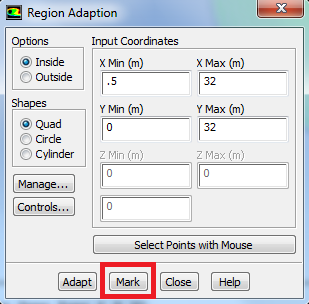
Click Mark then click Close. This will select the cells bounded by these four points, so we can change the initial condition in them. (Note: If you instead "patch" the region 0.5 < x < 32 and -5 < y < 5, the periodic vortex shedding starts much quicker; so we recommend that).
Click Mark then click Close. This will select the cells bounded by these four points, so we can change the initial condition in them.
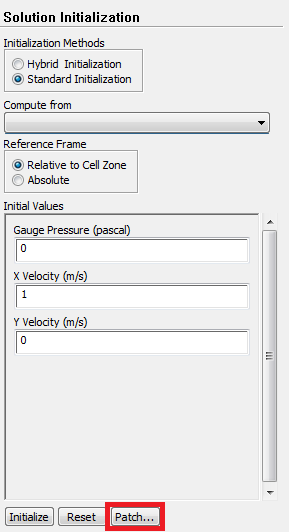
Next, click Patch.
Complete the patching menu as shown below. This will change the initial Y component of velocity in the selected region from 0 to 0.2 m/s. 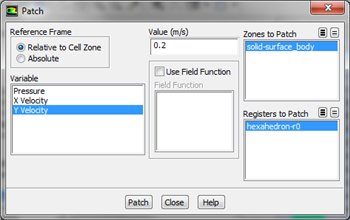
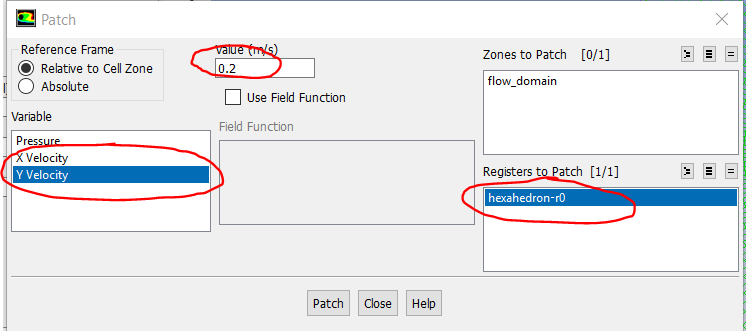
Click Patch,then click close.
...
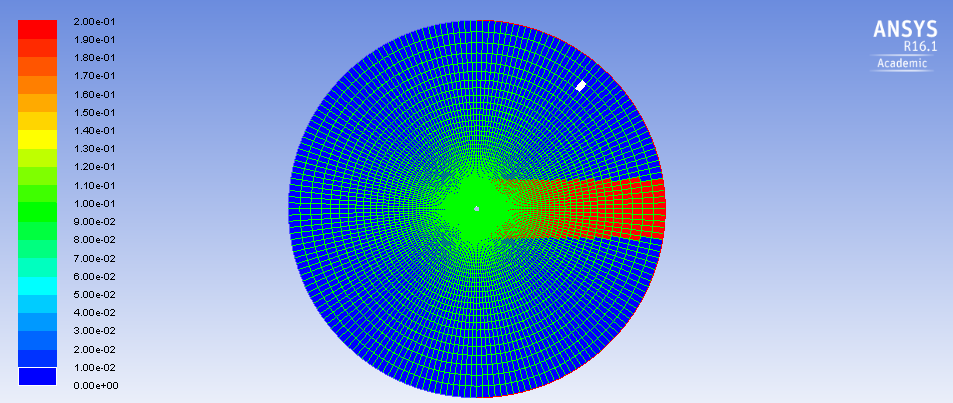
You should see the following image in the graphics window . The patched region is in red, where we have changed the Y velocity to be .2 m/s to quickly induce the vortex shedding. (Note the following image is inconsistent with the settings above which perturb the initial guess only above the x axis. Sorry.)
Setting Up Data Export to Create Animation
...
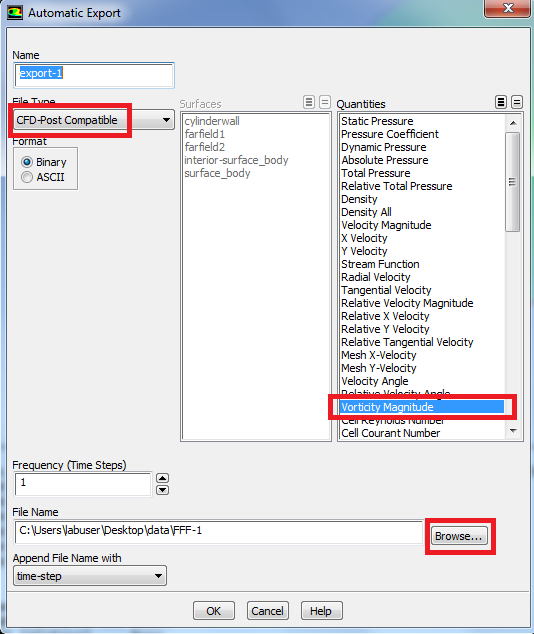
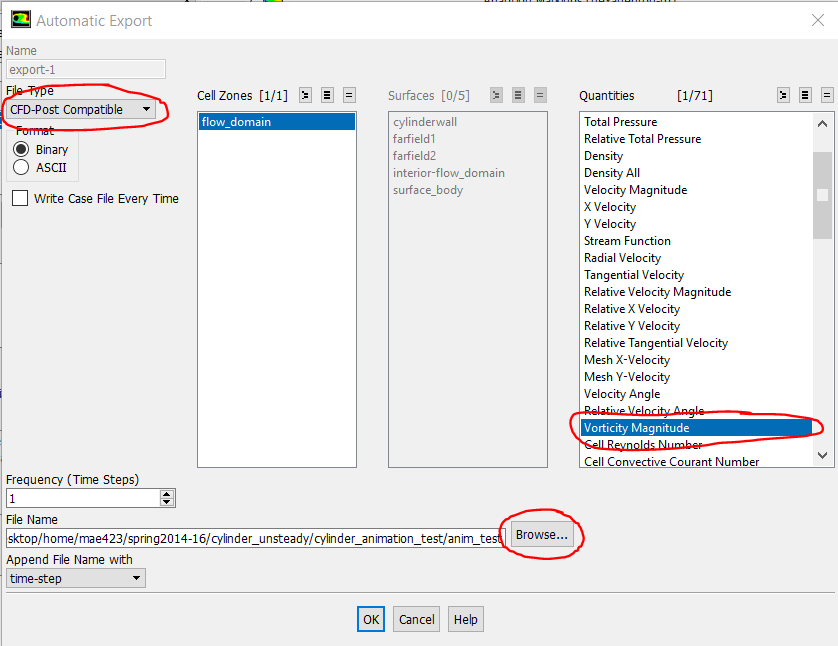
Next, change File Type to CFD-Post compatible, as this is the program we will use for post processing. Then, select Vorticity Magnitude from the list of variables on the right, so we can make an animation of contours of vorticity. Finally, click Browse, and choose a convenient file location on your local drive to place save the data files. Do NOT choose a folder on a flash drive as that has slow data input/output and can also cause Fluent to crash. Make note of this location for later use.
Advance Solution in Time
...