 Sign-up for free online course on ANSYS simulations!
...
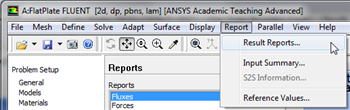
Now, we will obtain the drag on the plate. First, click on Report then click on Result Reports..., as shown in the following image.
| newwindow | ||||
|---|---|---|---|---|
| ||||
https://confluence.cornell.edu/download/attachments/118771111/Report_RR_Full.png |
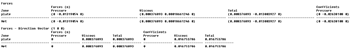
Next, double click on Forces and click Print in the Force Reports menu. You should then obtain the following output in the command pane.
| newwindow | ||||
|---|---|---|---|---|
| ||||
https://confluence.cornell.edu/download/attachments/118771111/ForceRep_Full.png |
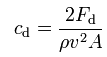
As one can see from the data above, the plate experiences a drag of approximately 0.008377 Newtons. Furthermore, the data states that the drag coefficient is approximately 0.01675. The drag coefficient is defined by the following equation.\
Go to Step 7: Verification & Validation
See and rate the complete Learning Module
Go to all FLUENT Learning Modules