 Sign-up for free online course on ANSYS simulations!
...
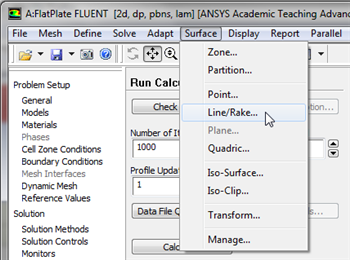
Here, we will plot the variation of the x component of the velocity along a vertical line in the middle of the geometry. In order to create the profile, we must first create a vertical line at x=0.5m, using the Line/Rake tool. First, (Click) Surface < Line/Rake as shown in the following image.
| newwindow | ||||
|---|---|---|---|---|
| ||||
https://confluence.cornell.edu/download/attachments/118771111/SurfLinRake_Full.png |
We'll create a straight vertical line from (x0,y0)=(0.5,0) to (x1,y1)=(0.5,0.5). Select Line Tool under Options. Enter x0=
0.5, y0=0,x1=0.5, y1=0.5. Enter line1 under New Surface Name. Your Line/Rake Surface menu should look exactly like the following image. Then, click Create. 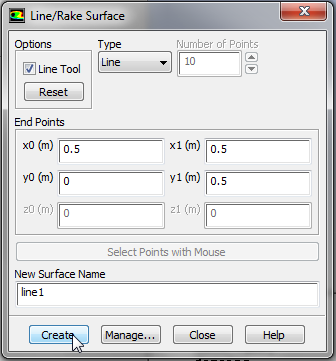
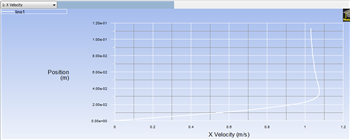
Next, click Create. Now, that the vertical line has been created we can proceed to the plotting. Click on Plots, then double click XY Plot to open the Solution XY Plot. In the Solution XY Plot menu, use the settings that were used from the section above, except select line1 under Surfaces and deselect any other geometry sections. Make sure that Write to File is not selected, then click Plot. You should obtain the following output.
| newwindow | ||||
|---|---|---|---|---|
| ||||
https://confluence.cornell.edu/download/attachments/118771111/Plot1M_Full.png |
Then, load in the Blasius solution velocity profile as was done in the previous section and click Plot. Your plot should change to the following image.
Pressure Coefficients
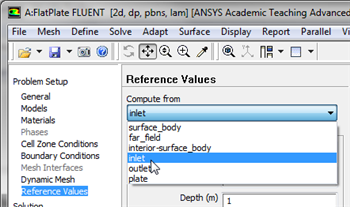
In this section we will create contour plots for the pressure coefficients. Before we begin, we must first set the reference values for velocity. In order to do so, first click on Reference Values then set Compute from to inlet, as shown below.
...