...
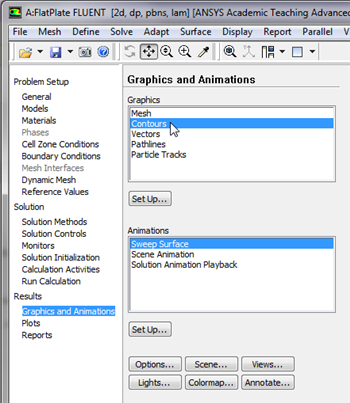
Next, click on Graphics and Animations, then double click on Contours, as shown below.
| newwindow |
|---|
| Higher Resolution Image |
|---|
| Higher Resolution Image |
|---|
|
https://confluence.cornell.edu/download/attachments/118771111/ContPlot_Full.png |
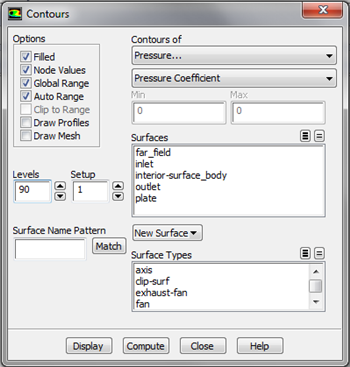
In the
Contours menu, set
Contours of to
Pressure... and set the box below to
Pressure Coefficient. Next, select
Filled and set
Levels to 90. Your
Contours menu should look exactly like the following image.
| newwindow |
|---|
| Higher Resolution Image |
|---|
| Higher Resolution Image |
|---|
|
https://confluence.cornell.edu/download/attachments/118771111/Contou_Full.png |
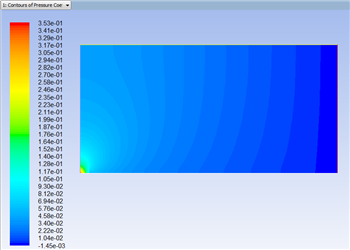
Lastly, click
Display in the
Contours menu to generate the contour plot. You should obtain the following output.
| newwindow |
|---|
| Higher Resolution Image |
|---|
| Higher Resolution Image |
|---|
|
https://confluence.cornell.edu/download/attachments/118771111/ContP1_Full.png |
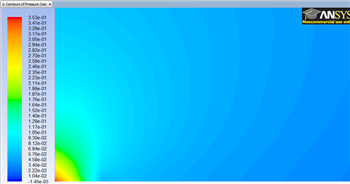
You can
zoom then zoom in to the leading edge of the plate with the wheel mouse button as shown below.
| newwindow |
|---|
| Higher Resolution Image |
|---|
| Higher Resolution Image |
|---|
|
https://confluence.cornell.edu/download/attachments/118771111/ContZoom_Full.png |
...
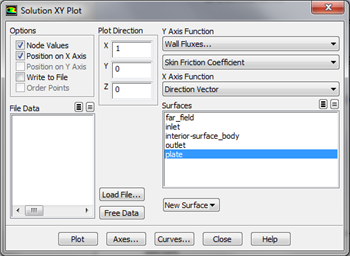
Here, the skin friction coefficient will be plotted as a function of distance along the plate. First, click on Plots, then double click on XY Plot, as shown below. In the Solution XY Plot menu deselect Write to File, select Position on X Axis, set X to 1 and set Y to 0. Then, set the box located underneath Y Axis Function to Wall Fluxes and set the box below to Skin Friction Coefficient. Next, select plate under Surfaces and deselect any other geometry features. At this point your Solution XY Plot menu should look the same as the following image.
| newwindow |
|---|
| Higher Resolution Image |
|---|
| Higher Resolution Image |
|---|
|
https://confluence.cornell.edu/download/attachments/118771111/SolXY3_Full.png |
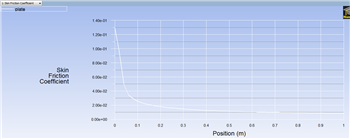
Make sure that for both the x and y axes, that
Auto Range is selected. Remember, that you must click
Apply to implement the changes you make. Then, click
Plot in the
Solution XY Plot menu and you should obtain the following output.
| newwindow |
|---|
| Higher Resolution Image |
|---|
| Higher Resolution Image |
|---|
|
https://confluence.cornell.edu/download/attachments/118771111/SkinFric1_Full.png |
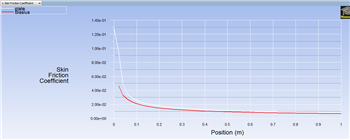
It is of interest to compare the numerical skin friction coefficient profile to the skin friction coefficient profile obtained from the Blasius solution. In order to plot the theoretical results, first click
here to download the necessary file. Save the file to your working directory. Next, go to the
Solution XY Plot menu and click
Load File... and select the file that you just downloaded,
BlasiusSkin.xy. Lastly, click
Plot in the
Solution XY Plot menu. You should then obtain the following figure.
| newwindow |
|---|
| Higher Resolution Image |
|---|
| Higher Resolution Image |
|---|
|
https://confluence.cornell.edu/download/attachments/118771111/SkinFric2_Full.png |
Lastly, select
Write to File located under
Options in the
Solution XY Plot menu. Then, click
Write.... When prompted for a filename, enter
SkinFriction.xy and save the file in your working directory.
...
 Sign-up for free online course on ANSYS simulations!