 Sign-up for free online course on ANSYS simulations!
...
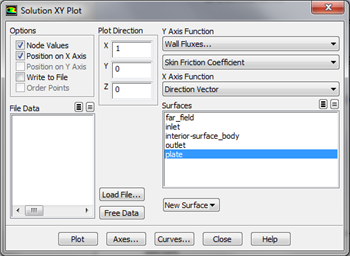
Here, the skin friction coefficient will be plotted as a function of distance along the plate. First, click on Plots, then double click on XY Plot, as shown below. In the Solution XY Plot menu deselect Write to File, select Position on X Axis, set X to 1 and set Y to 0. Then, set the box located underneath Y Axis Function to Wall Fluxes and set the box below to Skin Friction Coefficient. Next, select plate under Surfaces and deselect any other geometry features. At this point your Solution XY Plot menu should look the same as the following image.
| newwindow | ||||
|---|---|---|---|---|
| ||||
https://confluence.cornell.edu/download/attachments/118771111/SolXY3_Full.png |
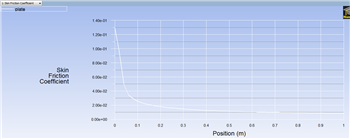
Make sure that for both the x and y axes, that Auto Range is selected. Remember, that you must click Apply to implement the changes you make. Then, click Plot in the Solution XY Plot menu and you should obtain the following output.
| newwindow | ||||
|---|---|---|---|---|
| ||||
https://confluence.cornell.edu/download/attachments/118771111/SkinFric1_Full.png |
Now, compare your solution to the with the Blasius solution's skin friction by loading the file and then plotting it with your solution. (Download file here)
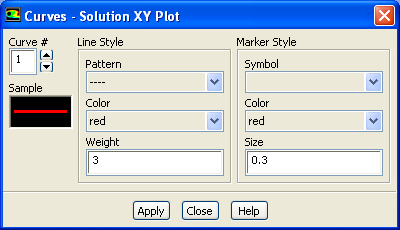
Also, you can change the symbol into lines by going to Curves... and click on the corresponding pattern that you like. Increase the Weight to 3 for readability. Both results should be fairly similar.
...