 Sign-up for free online course on ANSYS simulations!
...
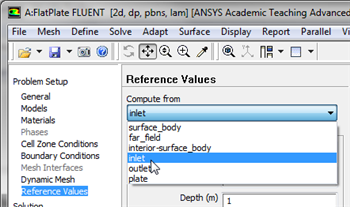
In this section we will create contour plots for the pressure coefficients. Before we begin, we must first set the reference values for velocity. In order to do so,
Now we will display the pressure coefficient contour but first we need to set the reference values for velocity. Go back to:
Problem Setup > Reference Values
first click on Reference Values then set Compute from to inlet, as shown below.
| newwindow | ||||
|---|---|---|---|---|
| ||||
https://confluence.cornell.edu/download/attachments/118771111/CompInlet_Full.png |
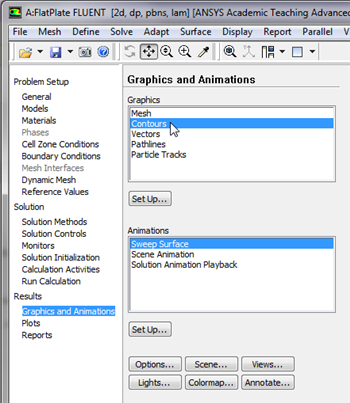
Next, click on Graphics and Animations, then double click on Contours, as shown below.
| newwindow | ||||
|---|---|---|---|---|
| ||||
https://confluence.cornell.edu/download/attachments/118771111/ContPlot_Full.png |
Results > Graphics and Animations > Graphics > Contours
...