 Sign-up for free online course on ANSYS simulations!
...
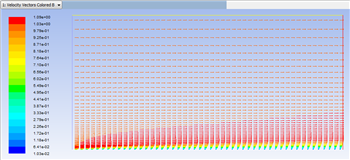
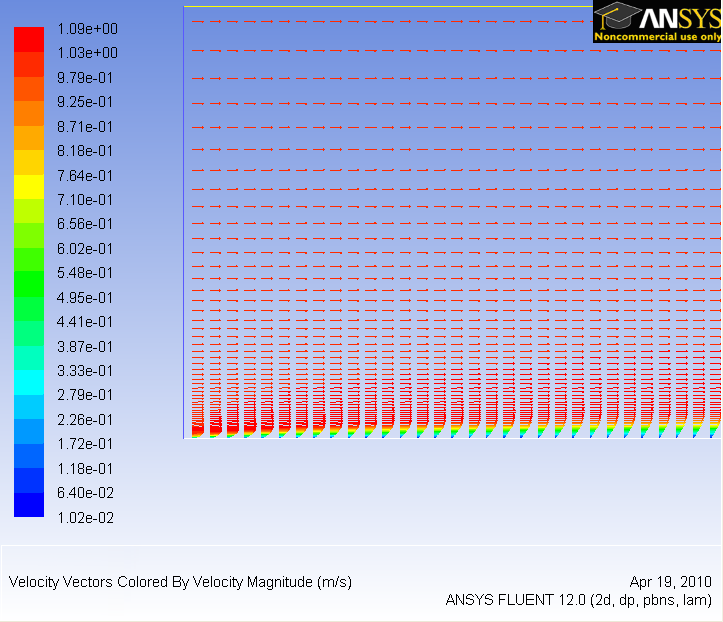
One can plot vectors in the entire domain, or on selected surfaces. Here, the vectors will be plotted for the entire domain. First, click on Graphics & Animations . Next, double click on Vectors which is located under Graphics. Then, click on Display in the Vectors menu. You should obtain, the following output.
| newwindow | ||||
|---|---|---|---|---|
| ||||
https://confluence.cornell.edu/download/attachments/118771111/VectPlot_Full.png |
Plot Velocity Vectors
Let's plot the velocity vectors obtained from the FLUENT solution.
Results > Graphics and Animations > Graphics > Vectors
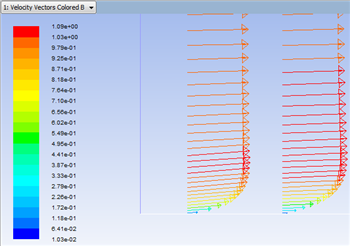
Zoom in a little using the middle mouse button to peer more closely at the velocity vectors.
You can use the wheel button of the mouse to zoom into the region that closely surrounds the plate, to get a better view of the boundary layer velocities.
| newwindow | ||||
|---|---|---|---|---|
| ||||
https://confluence.cornell.edu/download/attachments/118771111/ |
...
VectPlot2_ |
...
Remember to save the image using
Main Menu > File > Save picture
You can then select coloring, resolution and format for your picture. Then click on Save and give a name to the file to save it.
Full.png |
Plot Pressure Coefficients
...