 Sign-up for free online course on ANSYS simulations!
...
Again, look at the bottom of the table. You will find that the shear stress is very small at this point as we mentioned above.
Comparison.
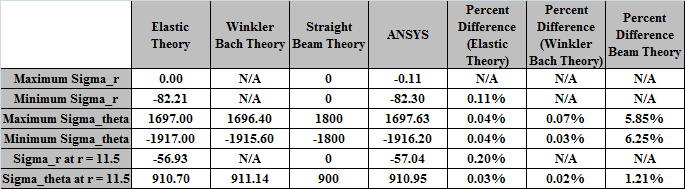
Now that we have our results from the ANSYS simulation, let's compare them to the theory calculations. Below is chart comparing the values found in ANSYS, and through calculations using the Elasticity Theory, Winkler-Bach Theory, and Straight Beam Theory (Note: all stress values are in psi)
Now, let's see how the stress distributions vary along the beam for each theory.
Continue to Step 3 - Homework
Go to all ANSYS Learning Modules