 Sign-up for free online course on ANSYS simulations!
...
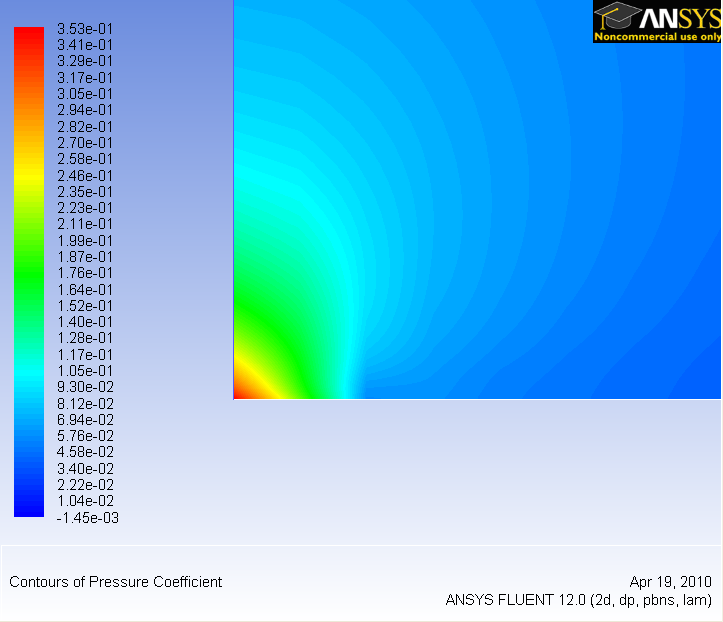
Zoom in at the leading edge.
| newwindow | ||||
|---|---|---|---|---|
| ||||
https://confluence.cornell.edu/download/attachments/118771111/step6_003.png?version=1 |
...
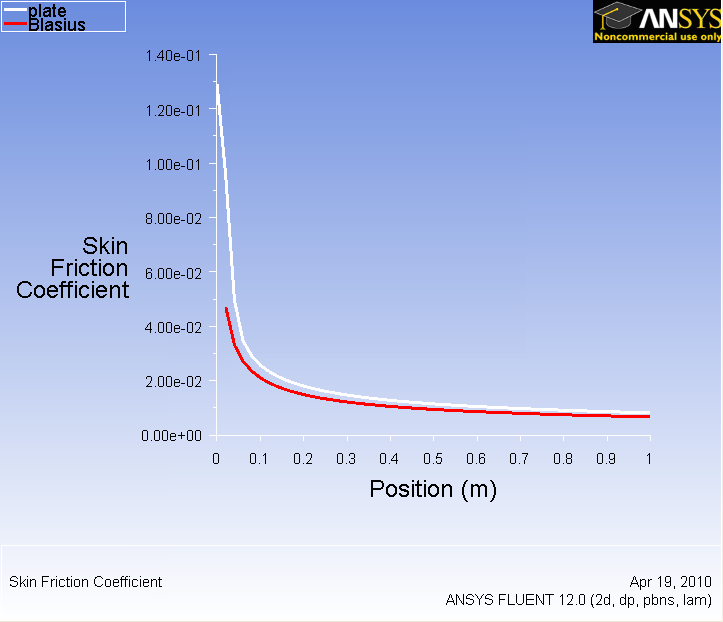
Change Pressure to Wall Fluxes. Then, change Wall Shear Stress to Skin Friction Coefficient. Under Surfaces, select plate.
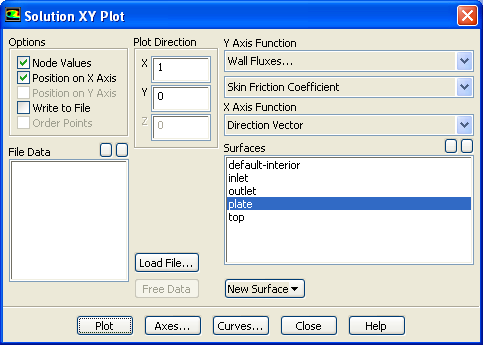
Click Plot.
Higher Resolution Image
| newwindow | ||||
|---|---|---|---|---|
| ||||
https://confluence.cornell.edu/download/attachments/118771111/step6_005.png?version=1 |
...
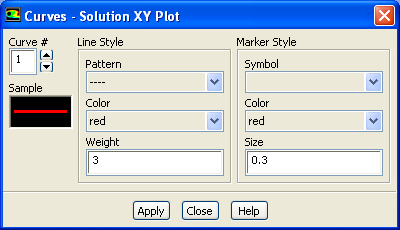
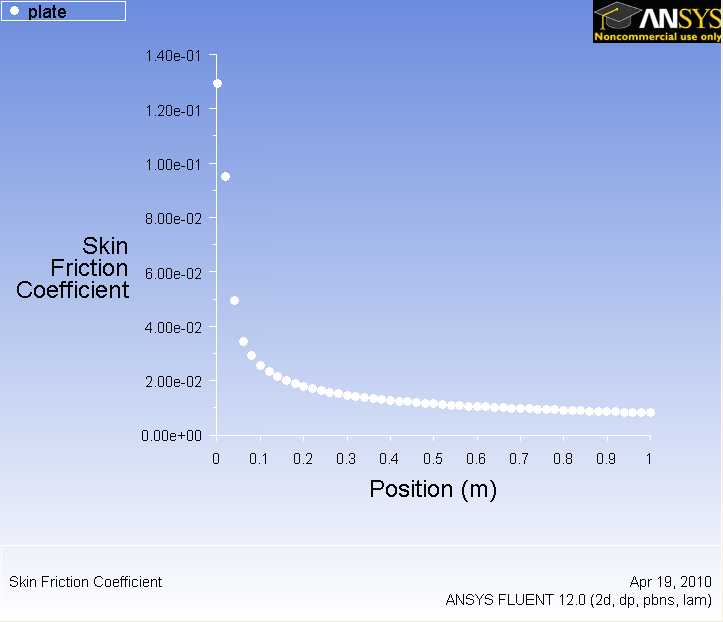
Also, you can change the symbol into lines by going to Curves... and click on the corresponding pattern that you like. Increase the Weight to 3 for readability. Both results should be fairly similar.
| newwindow | ||||
|---|---|---|---|---|
| ||||
https://confluence.cornell.edu/download/attachments/118771111/step6_007.png?version=1 |
...
Uncheck Position on X Axis and check Position on Y Axis under Options. Under Plot Direction, set X to 0 and Y to 1. Under X Axis Function, select Velocity...Then, change Velocity Magnitude to X Velocity. Finally under surface, select outlet. Before we are ready to plot, click on the Axes... button and rescale the y-axis from 0 to 0.12. Also, check the Major Rules and Minor Rules for both axes. Remember that you must click the Apply button when performing changes in each axis.
Click Plot.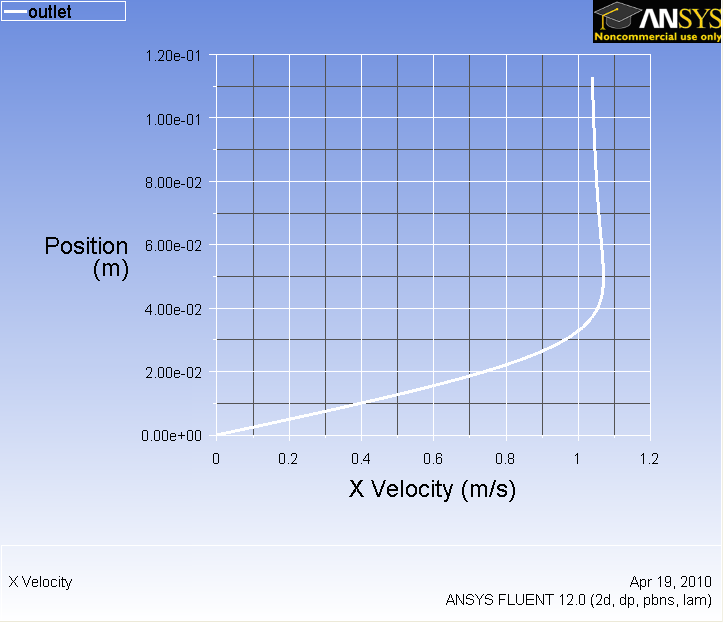
Higher Image Resolution
| newwindow | ||||
|---|---|---|---|---|
| ||||
https://confluence.cornell.edu/download/attachments/118771111/step6_008.png?version=1 |
...
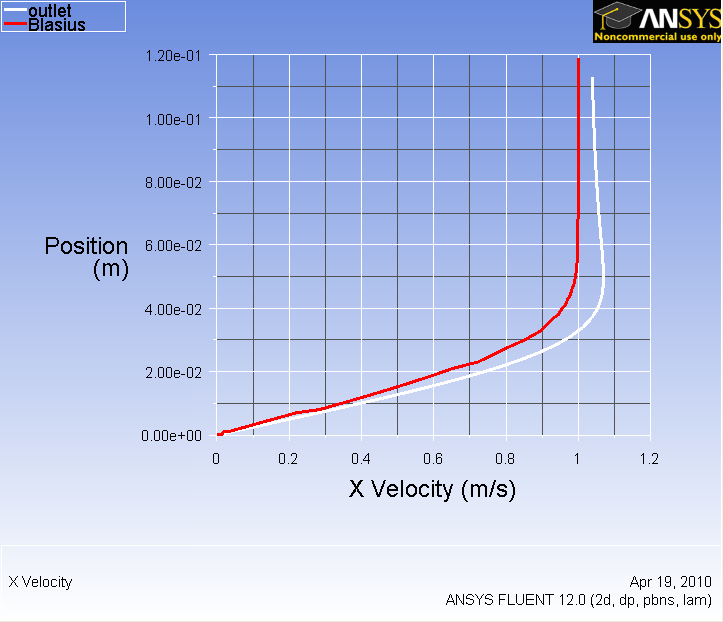
To compare with the Blasius solution, download the solution here. Click Load File...and select the file you just downloaded. Then plot the solutions again to display both lines on the same graph.
| newwindow | ||||
|---|---|---|---|---|
| ||||
https://confluence.cornell.edu/download/attachments/118771111/step6_009.png?version=1 |
...
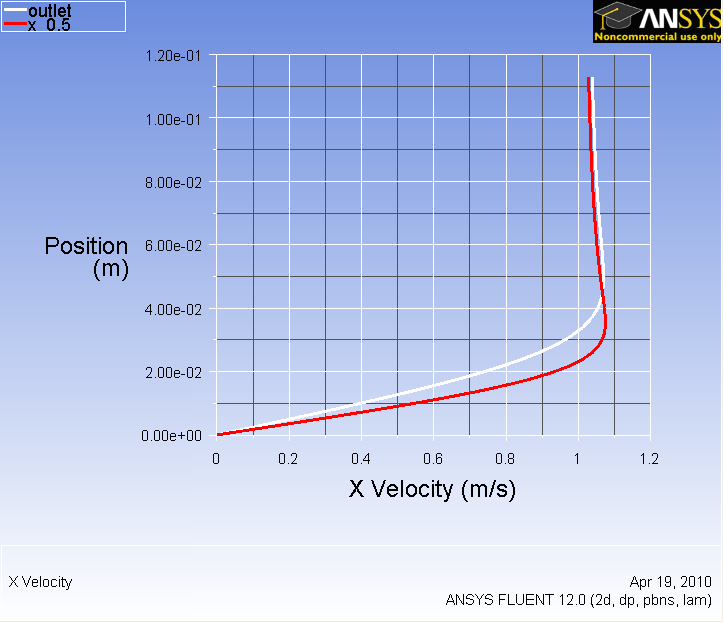
Under Surfaces, select outlet and {}x_0.5 and Plot.
| newwindow | ||||
|---|---|---|---|---|
| ||||
https://confluence.cornell.edu/download/attachments/118771111/step6_010.png?version=1 |
...