 Sign-up for free online course on ANSYS simulations!
| Include Page | ||||
|---|---|---|---|---|
|
| Include Page | ||||
|---|---|---|---|---|
|
Step 6: Numerical Results
Total Deformation
...
https://confluence.cornell.edu/download/attachments/125812731/10ElemTotDefCornellian_full.png...
When ANSYS displays the beam deformation, it just connects the displacements at nodes by straight lines. The display ignores the fact that the we also have the slope at the nodes. So you'll see an unphysical-looking jagged line in the deformation display. This is a shortcoming of the display, not of the underlying beam element formulation. You'll see the displayed deformed shape getting smoother as you refine the mesh.
...
Plot Deformed Shape of Midline
| HTML |
|---|
<iframe width="560" height="315" src="https://www.youtube.com/embed/Zf9zYFNXkaI" frameborder="0" allowfullscreen></iframe> |
Plot Bending Stress
| HTML |
|---|
<iframe width="560" height="315" src="https://www.youtube.com/embed/_04tFkcaqXw" frameborder="0" allowfullscreen></iframe> |
Plot Bending Moment
| HTML |
|---|
<iframe width="560" height="315" src="https://www.youtube.com/embed/t2uTPPyIVEI" frameborder="0" allowfullscreen></iframe> |
Probe Displacement
| HTML |
|---|
<iframe width="560" height="315" src="https://www.youtube.com/embed/SA-rmkqkbm0" frameborder="0" allowfullscreen></iframe> |
Check Your Understanding
Select the correct option below.
Consider the case where we replace our square cross-section in ANSYS with an I-shaped cross-section that is taller, has a lower cross-sectional area and the same moment of inertia. If we then re-solve the problem in ANSYS, which of the following results would be affected? Select all options that apply.
Maximum Bending Stress
...
Note that in this display, ANSYS shows the same value across the cross-section. This visualization is misleading. The maximum bending stress occurs only at the top fiber. The value that ANSYS reports is 4.635 MPa which matches the value from the Pre-Analysis exactly.
Bending Moment
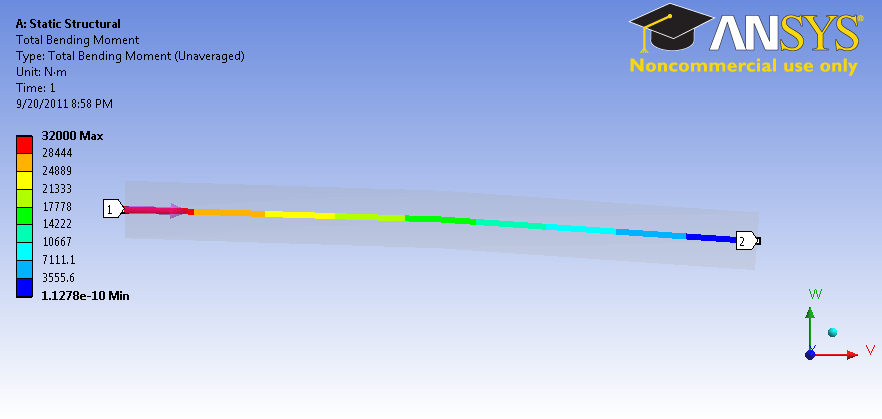
To view the bending moment along the beam, click Total Bending Moment in the Outline window. You should see the following in the graphics window.
...
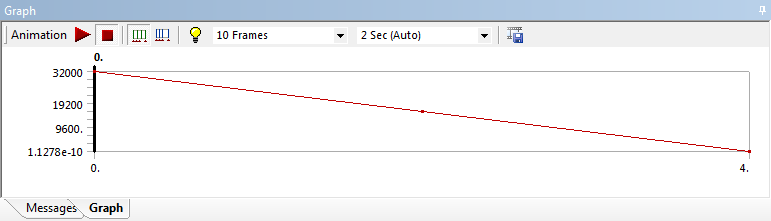
https://confluence.cornell.edu/download/attachments/125812731/BendingMoment.png?version=1&modificationDate=1316567309000Also notice that the values were plotted in a graph in the Graph window and also displayed in a table. The values can be exported into a Excel or text file by right-clicking on the table.
...
https://confluence.cornell.edu/download/attachments/125812731/Graph.png?version=1&modificationDate=1316567430000In the above, pay close attention to maximum and minimum values of the bending moment. At the left end, the bending moment is 32000 Nm; the calculation for moment is
| Latex |
|---|
$
M = F \times d = (8000 N) \times (4 m) = 32000 \mbox{ Nm}
$
|
So this checks out. We also notice that the minimum moment 1.1278E-10 Nm. Because this value is over 1E-14 smaller that the largest value, it can be assumed to be zero to machine precision.
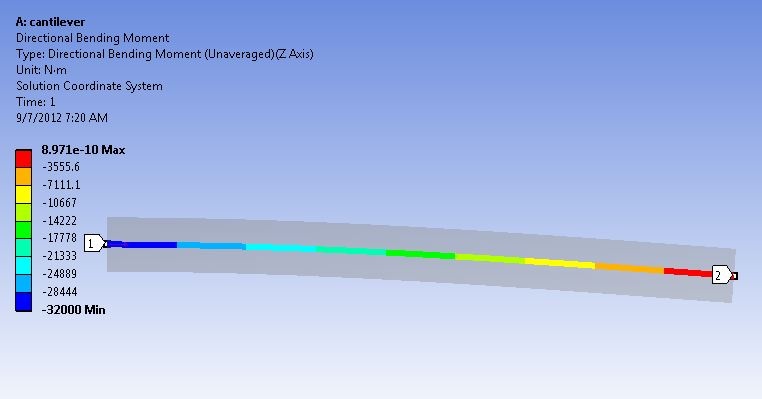
Directional Bending Moment
To view the directional bending moment along the beam, click Directional Bending Moment in the Outline window. You should see the following in the graphics window. The Directional Bending Moment gives us the sign along with the magnitude.
...
Deformed shape of the midline, u_y(x)
Max. bending stress at root