 Sign-up for free online course on ANSYS simulations!
...
Why is the pressure not constant at the leading edge of the plate?
Plot Skin Friction
...
Coefficient
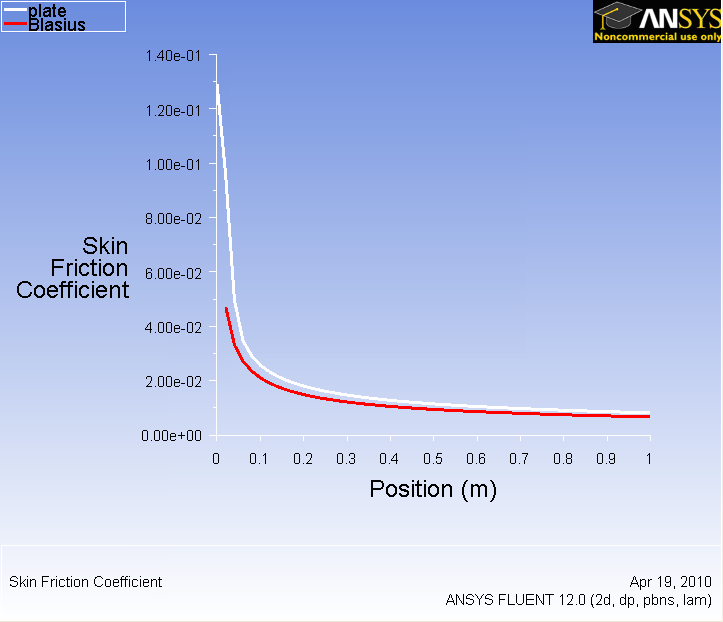
Now we will plot the skin friction coefficient along the flat plate.
...
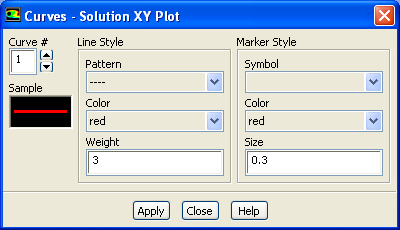
Also, you can change the symbol into lines by going to Curves... and click on the corresponding pattern that you like. Increase the Weight to 3 for readability. Both results should be fairly similar.
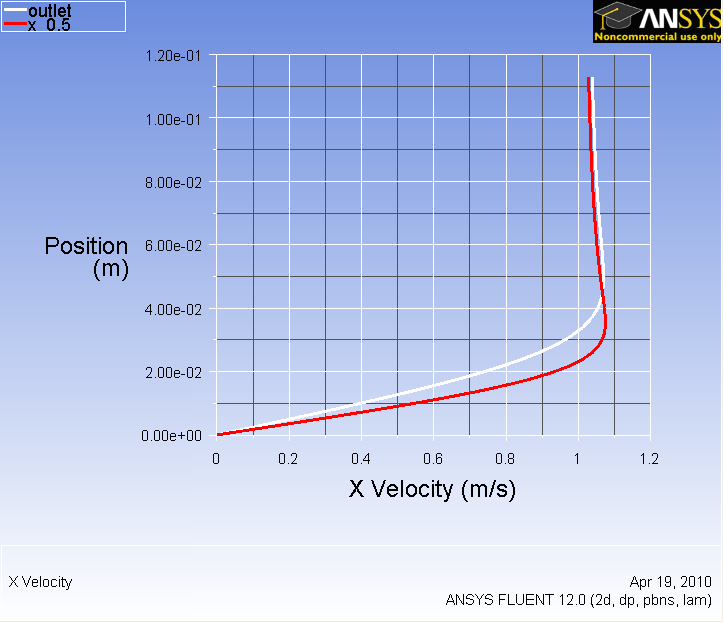
Higher Resolution ImageNow we will look at the velocity along the plate at outlet.
Plot Velocity Profiles
Results > Plots > XY Plot
...
Now we will compare the velocity profile at two sections. Create another section in the middle of the plate.
...
Again, in the XY Plot window under New Surface > Line/Rake
...
Under Surfaces, select outlet and and {}x_0.5 and Plot.
...