 Sign-up for free online course on ANSYS simulations!
| Include Page | ||||
|---|---|---|---|---|
|
| Include Page | ||||
|---|---|---|---|---|
|
Post Processing
Plot Velocity Vectors and Contours
| HTML |
|---|
<iframe width="560" height="315" src="https://www.youtube.com/embed/DCbh6z1v1wY" frameborder="0" allow="accelerometer; autoplay; encrypted-media; gyroscope; picture-in-picture" allowfullscreen></iframe> |
Note: In the below video (Plot Pressure Contours), please note that the cursor disappears accidentally at the 44 second mark and returns at the 3 minute mark. At 1 minute 17 seconds, "here" refers to the bottom-middle of the region near the plate. It is later drawn at the 1 minute 28 second mark. At 2 minute 40 seconds, "here" refers to the left most face, known as the inlet face, of the region.
Plot Pressure Contours
| HTML |
|---|
<iframe width="560" height="315" src="https://www.youtube.com/embed/KRQ0rtKCJ3w" frameborder="0" allow="accelerometer; autoplay; encrypted-media; gyroscope; picture-in-picture" allowfullscreen></iframe> |
Plot Velocity Profiles
| HTML |
|---|
<iframe width="560" height="315" src="https://www.youtube.com/embed/t3p52LPLw-A" frameborder="0" allow="accelerometer; autoplay; encrypted-media; gyroscope; picture-in-picture" allowfullscreen></iframe> |
Explanation for Velocity Profile Overshoot
| HTML |
|---|
<iframe width="560" height="315" src="https://www.youtube.com/embed/LnIsw07iuew?rel=0" frameborder="0" allowfullscreen></iframe> |
Check Similarity Principle
| HTML |
|---|
<iframe width="560" height="315" src="https://www.youtube.com/embed/Qde3pryaQ2A" frameborder="0" allow="accelerometer; autoplay; encrypted-media; gyroscope; picture-in-picture" allowfullscreen></iframe> |
Plot Velocity Derivatives
| HTML |
|---|
<iframe width="560" height="315" src="https://www.youtube.com/embed/kn6zk0AWsps" frameborder="0" allow="accelerometer; autoplay; encrypted-media; gyroscope; picture-in-picture" allowfullscreen></iframe> |
Calculate Drag Coefficient
| HTML |
|---|
<iframe width="560" height="315" src="https://www.youtube.com/embed/YrMyfB6n_W0" frameborder="0" allow="accelerometer; autoplay; encrypted-media; gyroscope; picture-in-picture" allowfullscreen></iframe> |
Go to Step 7: Verification & Validation
| Panel |
|---|
Author: John Singleton and Rajesh Bhaskaran, Cornell University Problem Specification |
| Note | ||
|---|---|---|
| ||
This page of this tutorial is currently under construction. Please check back soon. |
| Info | ||
|---|---|---|
| ||
Click here for the FLUENT 6.3 version. |
Step 6: Results
Velocity Vectors
...
https://confluence.cornell.edu/download/attachments/118771111/VectPlot_Full.png...
https://confluence.cornell.edu/download/attachments/118771111/VectPlot2_Full.pngOutlet Velocity Profile
...
https://confluence.cornell.edu/download/attachments/118771111/xyplotsetup_Full.png...
https://confluence.cornell.edu/download/attachments/118771111/SolXY1_Full.png...
https://confluence.cornell.edu/download/attachments/118771111/XVelPlot1_Full.png...
https://confluence.cornell.edu/download/attachments/118771111/CurveMen_Full.png...
https://confluence.cornell.edu/download/attachments/118771111/AxesMen1_Full.png...
https://confluence.cornell.edu/download/attachments/118771111/Axes2_Full.png...
https://confluence.cornell.edu/download/attachments/118771111/Plot5_Full.png...
https://confluence.cornell.edu/download/attachments/118771111/Plot6_Full.pngPressure Coefficients
...
https://confluence.cornell.edu/download/attachments/118771111/CompInlet_Full.png...
https://confluence.cornell.edu/download/attachments/118771111/ContPlot_Full.png...
https://confluence.cornell.edu/download/attachments/118771111/Contou_Full.png...
https://confluence.cornell.edu/download/attachments/118771111/ContP1_Full.png...
https://confluence.cornell.edu/download/attachments/118771111/ContZoom_Full.pngSkin Friction Coefficient
Here, the skin friction coefficient will be plotted as a function of distance along the plate.
Results > Plots > XY Plot
Change Pressure to Wall Fluxes. Then, change Wall Shear Stress to Skin Friction Coefficient. Under Surfaces, select plate.
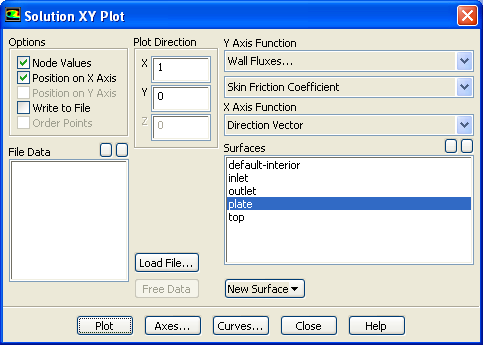
Click Plot.
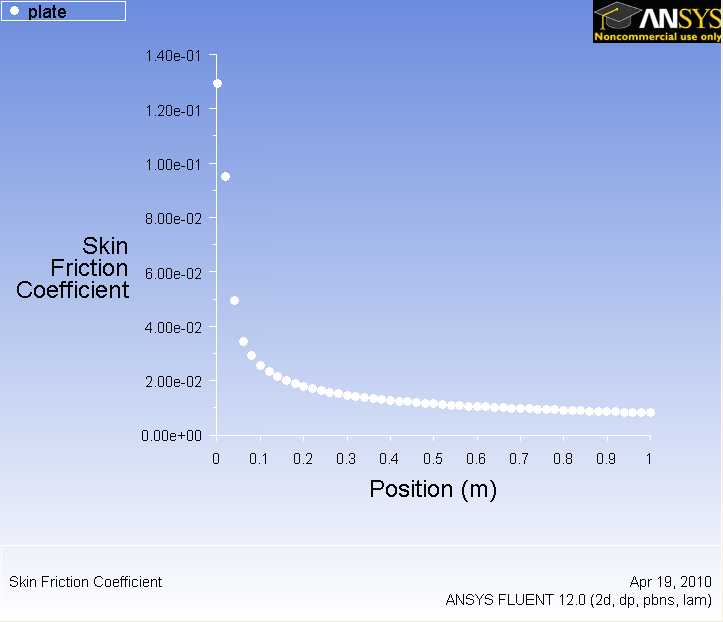
...
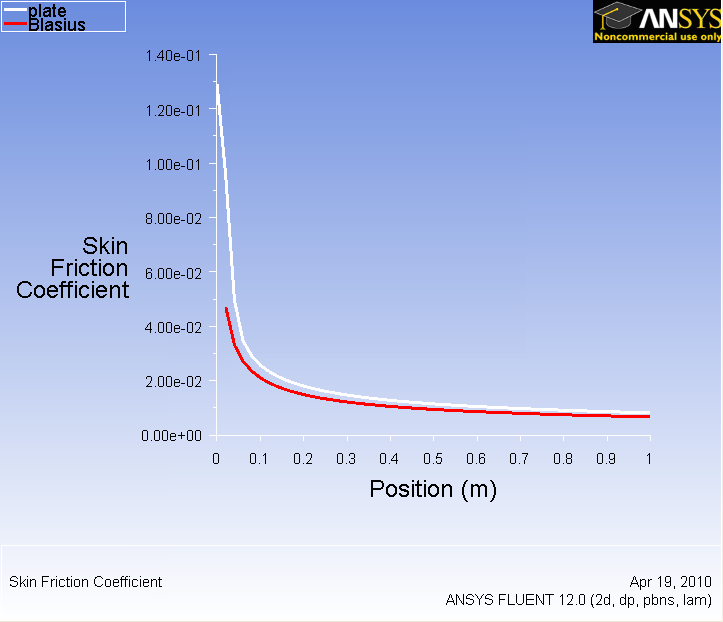
https://confluence.cornell.edu/download/attachments/118771111/step6_005.png?version=1Now, compare your solution to the with the Blasius solution's skin friction by loading the file and then plotting it with your solution. (Download file here)
...
...
https://confluence.cornell.edu/download/attachments/118771111/step6_007.png?version=1 Go to Step 7: Verification & Validation
See and rate the complete Learning Module