 Sign-up for free online course on ANSYS simulations!
...
Your solution should look something like the plots below:
Centerline Velocity
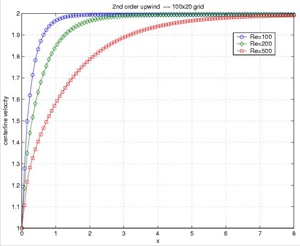 (Click picture for larger image)
| newwindow | ||||
|---|---|---|---|---|
| ||||
https://confluence.cornell.edu/download/attachments/85624219/ps2velfull.JPG?version=1 |
Skin Coefficient
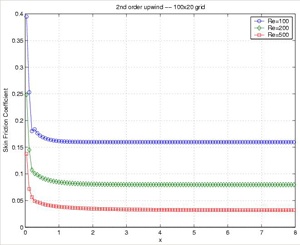 (Click picture for larger image)
| newwindow | ||||
|---|---|---|---|---|
| ||||
https://confluence.cornell.edu/download/attachments/85624219/ps2cffull.JPG?version=1 |
See and rate the complete Learning Module
Go to all FLUENT Learning Modules