 Sign-up for free online course on ANSYS simulations!
...
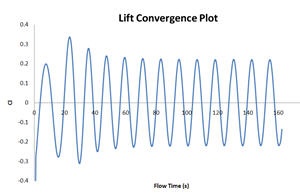
We can see a clear sinusoidal pattern, a sign of sustained vortex shedding process after 40s.This plot can be used to compute the correct value of Strouhal number. The problem is non-dimensionalized (D = 2, U = 1) and Sr = f*D/U = 0.0846 * 2 = 0.169. The results matches fairly well with the value (0.183) as reported by Williamson (link)
| Info | |||||||
|---|---|---|---|---|---|---|---|
| |||||||
To accurately calculate the shedding frequency, take an average of at least 10 shedding cycles (e.g 10 Cl peak) . Also, open the
|
Main Menu > File > Write > Case & Data...
Use the default name (Mesh's file name "cylinder") and click OK.
...