 Sign-up for free online course on ANSYS simulations!
| Panel |
|---|
Problem Specification |
Step 6: Analyze Results
...
| Info | ||||||||||||||||
|---|---|---|---|---|---|---|---|---|---|---|---|---|---|---|---|---|
| ||||||||||||||||
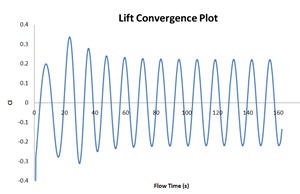
| Wiki Markup | To accurately calculate the shedding frequency, open the cl-history file (saved previously in the same location where the original mesh was read) and plot the data using excel for better data representation and graphing option. Take an average of 10 shedding cycles (e.g 10 CL peak).
An example of Lift Convergence Plot plotted using excel is shown below:
|
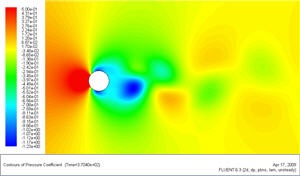
Display Pressure Contours
Main Menu > Display > Contours
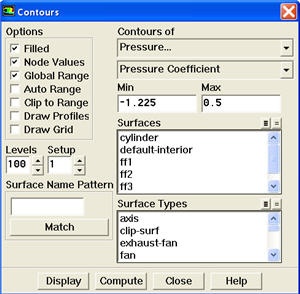
Under Contours of, choose Pressure.. and Pressure Coefficient. Select the Filled option. Increase the number of contour levels plotted. Set Levels to 100. Disable Auto Range and Clip to Range from the Options group box. Enter -1.225 and 0.5 for Min and Max, respectively.Click Display.
| newwindow | ||||
|---|---|---|---|---|
| ||||
https://confluence.cornell.edu/download/attachments/107011458/pressure%20coefficient%20contour%20plot.jpg |
...
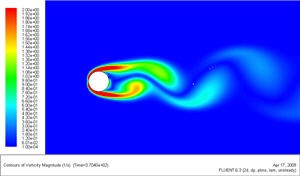
Main Menu > Display > Contours
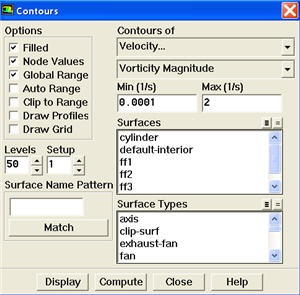
Under Contours of, choose Velocity.. and Vorticity Magnitude. Disable Auto Range and Clip to Range from the Options group box. Enter 0.0001 and 2 for Min and Max, respectively. Select Levels to 50. Click Display.
| newwindow | ||||
|---|---|---|---|---|
| ||||
https://confluence.cornell.edu/download/attachments/107011458/vorticity%20magnitude%20contour%20plot.jpg |
...