 Sign-up for free online course on ANSYS simulations!
...
Select Nodal Solution > Stress > von Mises stress and click OK.

(Click picture for larger image)
The contour plot will show you the locations of the maximum and minimum values with the labels MX and MN, respectively. Are these locations where you expect them? SMX and SMN values reported in the Graphics window are the corresponding maximum and minimum stress values.
...
Select Element Solution > Stress > von Mises stress and click OK. This displays the von Mises stress results as discontinuous element contours.
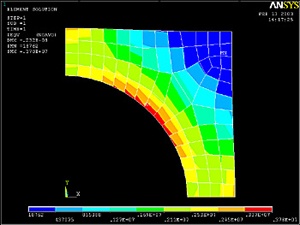 (Click picture for larger image)
Save this plot to a file: Utility Menu > PlotCtrls > Hard Copy > To File
...