 Sign-up for free online course on ANSYS simulations!
| Panel |
|---|
Author: Rajesh Bhaskaran and Yong Sheng Khoo, Cornell University Problem Specification |
Step 7: Refine Mesh
...
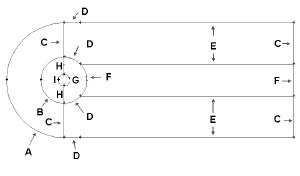
Follow Step 1 through Step 5. At step 2, use the following edge mesh properties instead.
| newwindow | ||||
|---|---|---|---|---|
| ||||
https://confluence.cornell.edu/download/attachments/104400914/step2_img001.jpg?version=1 |
Label | Medium Mesh (Original) | Coarse Mesh | Fine Mesh |
A | Interval Count: 36, Double First Length: 0.5 | Interval Count: 24, Double First Length: 0.7 | Interval Count: 54, Double First Length: 0.3 |
B | Interval Count: 36, Double First Length: 0.2 | Interval Count: 24, Double First Length: 0.3 | Interval Count: 54, Double First Length: 0.12 |
C | Interval Count: 30, First Length: 0.1 | Interval Count: 20, First Length: 0.2 | Interval Count: 45, First Length: 0.09 |
D | Interval Count: 18 | Interval Count: 12 | Interval Count: 27 |
E | Interval Count: 90, First Length: 0.1 | Interval Count: 60, First Length: 0.15 | Interval Count: 135, First Length: 0.07 |
F | Interval Count: 36 | Interval Count: 24 | Interval Count: 54 |
G | Interval Count: 72 | Interval Count: 48 | Interval Count: 108 |
H | Interval Count: 30 | Interval Count: 20 | Interval Count: 45 |
I | Interval Count: 36, Double First Length: 0.05 | Interval Count: 24, Double First Length: 0.07 | Interval Count: 54, Double First Length: 0.03 |
| Info | ||
|---|---|---|
| ||
You can also change the appropriate parameters (interval count and |
| Info | ||
|---|---|---|
| ||
To double the mesh density, the interval count is increased by factor of 1.5. The first length is decreased by a factor of about 1.5. To half the mesh density, the interval count is decreased by factor of 1.5. The first length is increased by a factor of about 1.5. Think about why it is so. |
...
After that, you should have three meshes with following mesh elements.
Coarse | Medium | Fine Mesh Elements | |
No. of cells | 6240 | 14040 | 31590 |
...
Your mesh should differ slightly from the above table. The mesh properties given to you in this tutorial are of less significant figures. Whereas the meshes used by the author were generated using script with exact accuracy.
Drag Coefficient Comparison
...
Taking medium as benchmark, we compare coarse and fine mesh. Note that the difference in drag coefficient between three meshes is negligibly small. For analysis of drag coefficient, it seems that coarse mesh provides enough resolution.
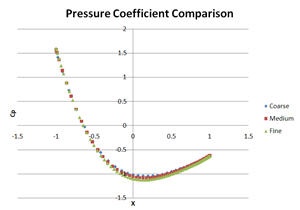
Pressure Coefficient Comparison
Let's analyze pressure coefficient plot around cylinder for three different mesh before we conclude which mesh to use. Let's start with a coarse mesh.
Plot > XY Plot...
Change the Y Axis Function to Pressure..., followed by Pressure Coefficient. Then, select cylinder under Surfaces. Check the option Write to File.
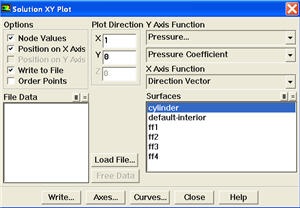
Click Write...
Enter the file name and directory to save.
Do the same for medium and fine meshes by opening different case and data files.
After that, open the files that you have written with excel spreadsheet. Compile and plot the data accordingly.
| newwindow | ||||
|---|---|---|---|---|
| ||||
https://confluence.cornell.edu/download/attachments/104400914/step6_Cpcompare2.jpg?version=1 |
| Info | ||
|---|---|---|
| ||
A quick and dirty way plotting three different mesh is to use FLUENT directly. Plot > XY Plot... You can Load File... that you have saved previously. However, using this way, you have less control of how you can present the data and is not recommended for report presentation. |
See and rate the complete Learning Module
...