 Sign-up for free online course on ANSYS simulations!
...
In the Options box, change back to Position on X Axis. In the Plot Direction box, enter the default values of 1 in the X box and 0 in the Y box. Under Y-Axis Function choose Wall Fluxes. In the box below, chose Total Surface Heat Flux. Select Plate under Surfaces. Before plotting, be sure to turn on Auto Range for the Y axis under Axes....
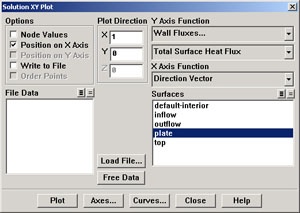
Click Plot.
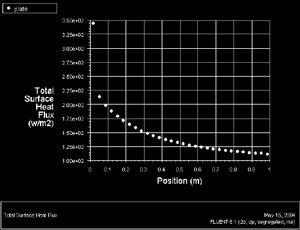
(click picture for larger image)
...
Now plot Re vs. Nu in Excel. Your plot should look like this:

(click picture for larger image)
...