 Sign-up for free online course on ANSYS simulations!
...
Make sure that Position on X Axis is set under Options, that 1 is the value next to X, and 0 is the value next to Y under Plot Direction. Recall that this tells FLUENT to plot the x-coordinate value on the abscissa of the graph. Select Turbulence... under Y Axis Function and select Wall Yplus from the drop down list under that. Since we want the y+ value for cells adjacent to the wall of the pipe, choose plate under Surfaces.
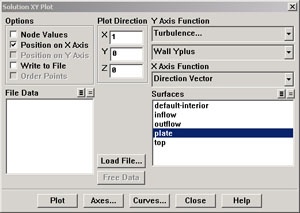
Click Plot.
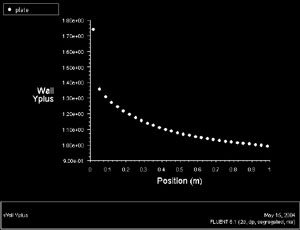
(Click picture for larger image)
...