 Sign-up for free online course on ANSYS simulations!
...
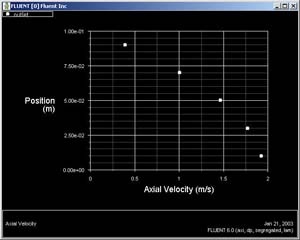
To plot the position variable on the y axis of the graph, uncheck Position on X Axis under Options and choose Position on Y Axis instead. To make the position variable the radial distance from the centerline, under Plot Direction, change X to 0 and Y to 1. To plot the axial velocity on the x axis of the graph, for X Axis Function, pick Velocity... and Axial Velocity under that.
Since we want to plot this at the outlet boundary, pick outlet under Surfaces.
Change both the x and y axes to Auto-Range. (Don't forget to click apply before selecting a different axis)
Uncheck Write to File under Options so that we can see the graph. Click Plot.
...
Save the data from this plot: Pick Write to File under Options and click Write.... Enter profile.xy for XY File and click OK.
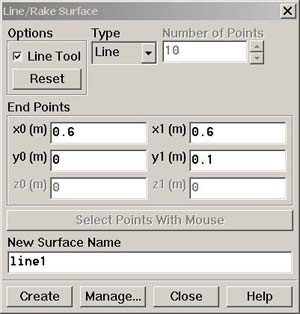
To see how the velocity profile changes in the developing region, let us add the profiles at x=0.6m (x/D=3) and x=0.12m (x/D=6) to the above plot. First, create a line at x=0.6m using the Line/Rake tool:
Main Menu > Surface > Line/Rake
We'll create a straight line from (x0,y0)=(0.6,0) to (x1,y1)=(0.6,0.1). Select Line Tool under Options. Enter x0=0.6, y0=0, x1=0.6, y1=0.1. Enter line1 under New Surface Name. Click Create.
To see the line just created, select
Main Menu > Display > Grid...
Note that line1 appears in the list of surfaces. Select all surfaces except default-interior. Click Display. This displays all surfaces but not the mesh cells. Zoom into the region near the inlet to see the line created at x=0.6m. (Click here to review the zoom functionality discussion in step 4.) line1 is the white vertical line to the right in the figure below.
...