 Sign-up for free online course on ANSYS simulations!
| Include Page | ||||
|---|---|---|---|---|
|
| Include Page | ||||
|---|---|---|---|---|
|
Numerical Results
| Info |
|---|
This page goes through the post-processing steps for the Supersonic Flow Over a Wedge in the CFD-Post post-processor included with ANSYS Workbench. For instructions on performing the post-processing using the classic FLUENT post-processor, see this page. |
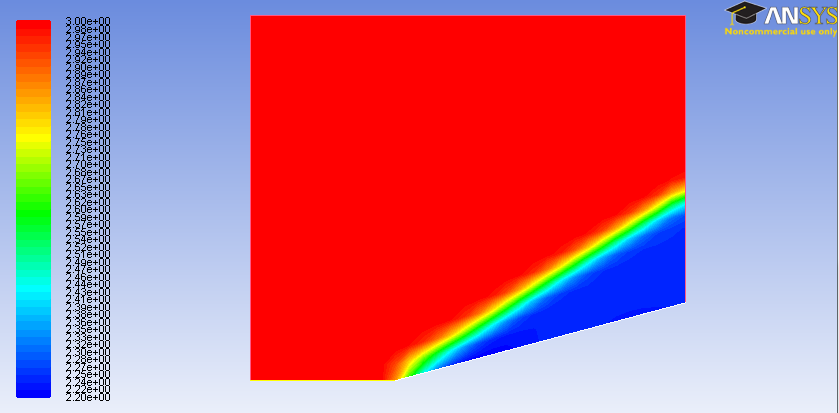
Mach Number Contours
The following video shows how to make a plot of the Mach number contours using CFD-Post. If the videos below don't appear in your browser, try reloading the webpage.
| HTML |
|---|
<iframe width="600" height="338" src="//www.youtube.com/embed/cZpjpNbxXYM" frameborder="0" allowfullscreen></iframe> |
| Note |
|---|
To properly send the additional quantities to CFD-Post, you need to do the following steps in the right order. First initialize your solution, then select the additional quantities as shown in the above video, and finally, run the calculation. (If you already ran the calculation and opened CFD-Post, you can update which quantities are transferred by selecting them and then running at least one iteration.) |
Summary of the above video:
- Some calculated parameters are not by default carried over into CFD-Post. We are interested in such quantities (i.e. Mach Number). To manually transfer a customized selection of quantities:
- Click File > Data File Quantities...
- Under Additional Quantities, select Static Pressure, Total Pressure, Mach Number, and Total Temperature.
- Post-processing will be done in CFD-Post. To open, double-click Results in Workbench.
- We are interested in viewing contours of Mach Number in CFD-Post
- Select Insert > Contour > Name > Mach No.
- Under Details of Mach No, select Locations > symmetry 1.
- Variable > Mach Number > No Contours = 101
- Turn on the mesh in the graphics pane
- Check the box next to symmetry 1 in the Outline tree > Click Render > Show Mesh Lines.
- Turn off the mesh by deselecting symmetry 1 in the outline tree
- Save a copy of the figure in the graphics pane
- Select the camera icon in the toolbar.
Pressure Contours
The following video shows how to make a plot of the pressure contours.
| HTML |
|---|
<iframe width="600" height="338" src="//www.youtube.com/embed/uPfpFds_JpQ" frameborder="0" allowfullscreen></iframe></iframe> |
Summary of the above video:
- Turn off the Mach Number contours in the graphics window
- Uncheck the box next to Mach no in the Outline tree.
- We are interested in viewing contours of pressure in CFD-Post
- Select Insert > Contour
- Name > Pressure Contours
- Under Details of Pressure contours, select Locations > symmetry 1.
- Variable > Pressure.
- To increase the number of contours to 101
- Under Details of Pressure contours, scroll down to # of Contours. Type “101”.
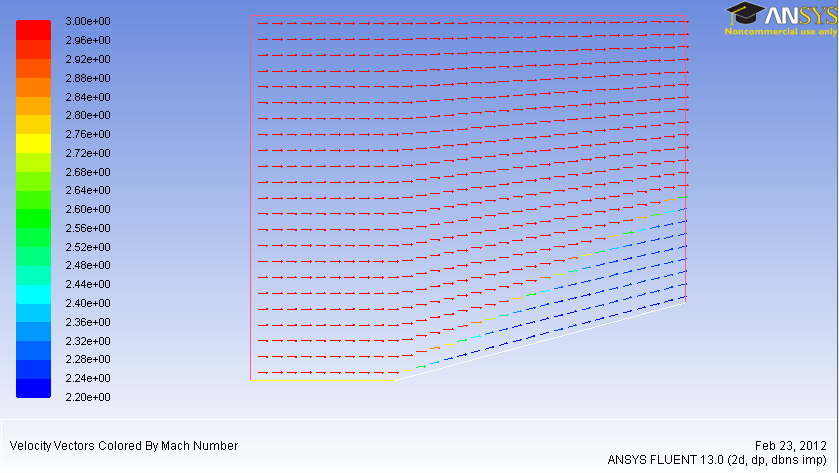
Velocity Vectors
To plot the velocity vectors, follow the steps in the video below.
| HTML |
|---|
<iframe width="600" height="338" src="//www.youtube.com/embed/sTm_G4W7ujQ" frameborder="0" allowfullscreen></iframe> |
Summary of the above video:
- We are interested in viewing velocity vectors in CFD-Post.
- Select Insert > Vector
- Type “Velocity vectors” under Name in the Insert Vector dialogue box that appears.
- Under Details of Velocity vectors, select Locations > symmetry 1.
- To make the velocity vectors more visible, turn off the pressure contours
- Uncheck the box next to Pressure contours in the Outline tree
Plot Mach Number Variation Along y=0.4 m
First, we'll create a line at y=0.4m. Then, we'll plot the Mach number variation along this line using the "Chart" facility in CFD-Post. These steps are shown in the video below. Note that you can export the data to a csv file using the Export button next to Apply in the Chart menu. You can then open the csv file in Excel to determine the values of Mach number, pressure etc. behind the shock to, say, 4 significant digits.
| HTML |
|---|
<iframe width="600" height="338" src="//www.youtube.com/embed/tJMbrxn7Jzw" frameborder="0" allowfullscreen></iframe> |
Summary of the above video:
- Insert line y = 0.4 m in CFD-Post.
- Select Location > Line > Name Line 1
- Under Details of Velocity vectors, type Point 1 coordinates (0,0.4,0) and Point 2 coordinates (1.5,0.4,0).
- Plot Mach Number along the newly created line y = 0.4 m
- Select Insert > Chart
- Type “Mach no along Line 1” under Name
- Under Details of Mach no along Line 1, select the Data Series tab. Select Location > Line 1.
- select the X Axis tab. Select Variable > X.
- select the Y Axis tab. Select Variable > Mach Number.
- To increase the number of samples along line y = 0.4 m to 100.
- Double click on Line 1 in the Outline tree.
- Under Details of Line 1, type “100” in Samples.
Go to Step 7: Verification & Validation
Go to all FLUENT Learning Modules
| Panel |
|---|
Author: Benjamin Mullen, Cornell University Problem Specification |
Results
Velocity Vectors
First, let's take a look at the velocity vectors. In the Outline window, under Results select Colors and Animations. In the Colors and Animations window, under Graphics, select Vectors. Then press Set Up....
In the Vectors window that opens, change the Scale of the arrows to 0.25, and change the Color by parameter to Velocity... Mach Number

Hit Display to view the vectors in the graphics window
Once you have plotted the velocity vectors, you may close the Vectors menu.
Mach Number Contours
Next, we will plot the contours of mach number. In the Graphics and Animations window under _Graphics, select Contours, and press Set Up.... Change the Contours Of parameter to Velocity... Mach Number. Next, check the box next to Filled.

Change the Levels to 50 and press Display
Pressure Coefficient Contours
Now, change the Contours Of parameter to Pressure... Pressure Coefficient and press Display.

When you have plotted the contours, you may close the Contours window.
Pressure Coefficient Along Wedge
In the Outline window under Results, select Plots. In the Plots window, select XY plot and press Set Up.... Change the Y Axis Function to Pressure... Pressure Coefficient, and select the Wedge under Surfaces.

To see the plot, press Plot
