 Sign-up for free online course on ANSYS simulations!
...
In order to verify that the simulation is accurate, it must be compared to a study that is similar in nature. We will compare the AIM results with results from Stanford University’s Aerospace Design Lab. In that study, users were expected to become familiar with performing an optimal space design in a 2D space. The airfoil used was also the NACA 0012, which makes this a perfect example to compare ours to. Below is the pressure contour that was plotted as a result of the Stanford tutorial, which can be directly compared to the pressure contour found in the previous section.

Return to the Results panel in the Workflow. Click on Results in the panel.
...
Below is the pressure contour plotted by AIM.

To make the comparison easier, expand the Appearance options and change Coloring to Banded, then change Number of colors to 20.
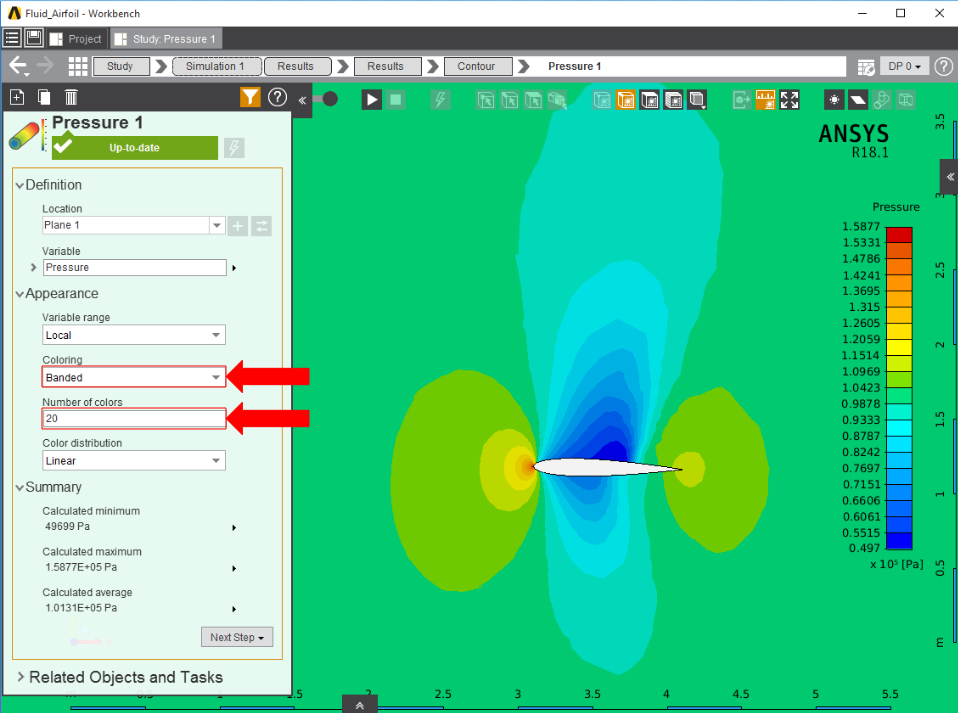
By comparing this to the Stanford’s pressure contour, it is easy to see that they are similar. Also, the numerical minimum and maximum values are significantly close, within 10%.
...