 Sign-up for free online course on ANSYS simulations!
...
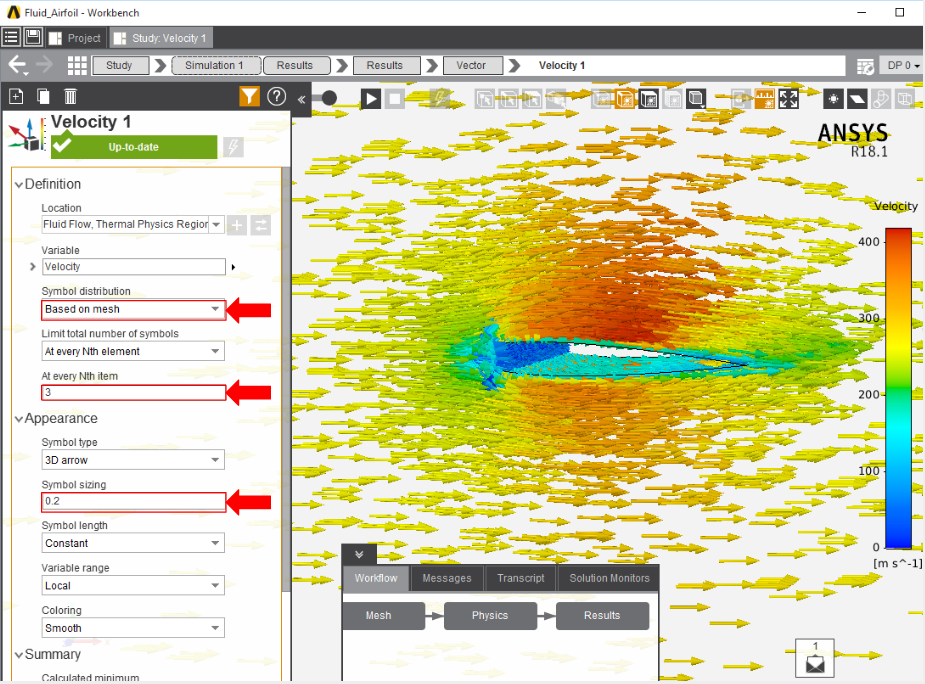
By default, the velocity vector arrows are too far from the airfoil to observe the flow characteristics. Select the Velocity Vector object to edit the settings with which the vectors are defined. Change Symbol distribution to Based on mesh and input 3 for At every Nth item. Press Evaluate to update the display. Under Appearance, change the Symbol sizing to 0.2 to shorten the arrows, then zoom in to see the arrows near the airfoil. Press the Play button in the model window to see how these velocity vectors develop over time.
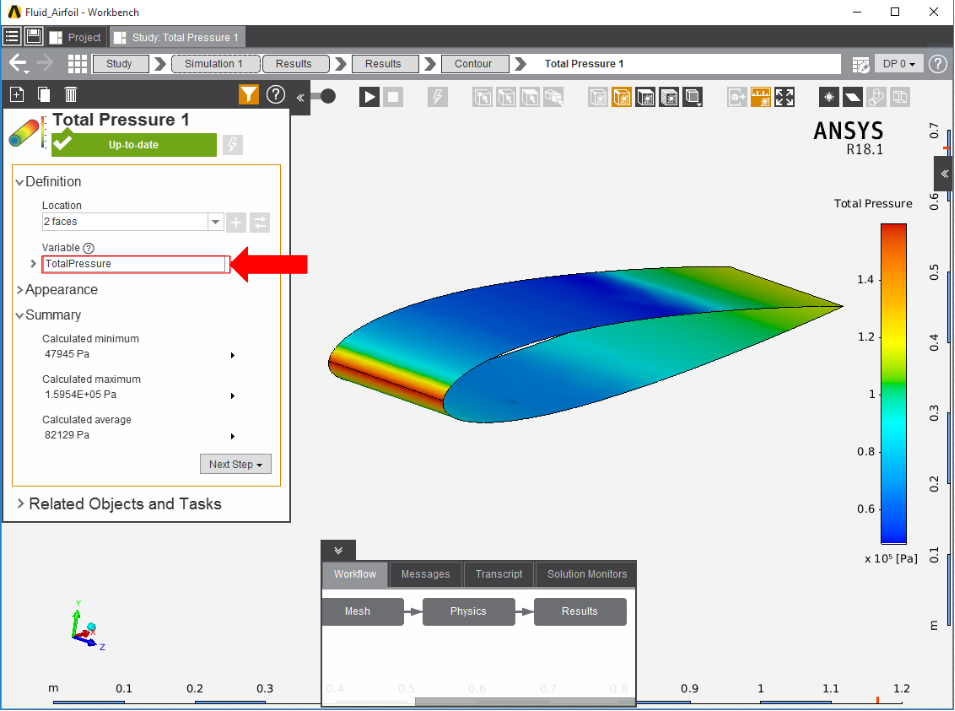
Pressure on the airfoil can be plotted by adding a Contour in the Add drop down menu of the Results panel. Use Total Pressure as the Variable and then select the faces of the flow volume touching the faces of the airfoil.
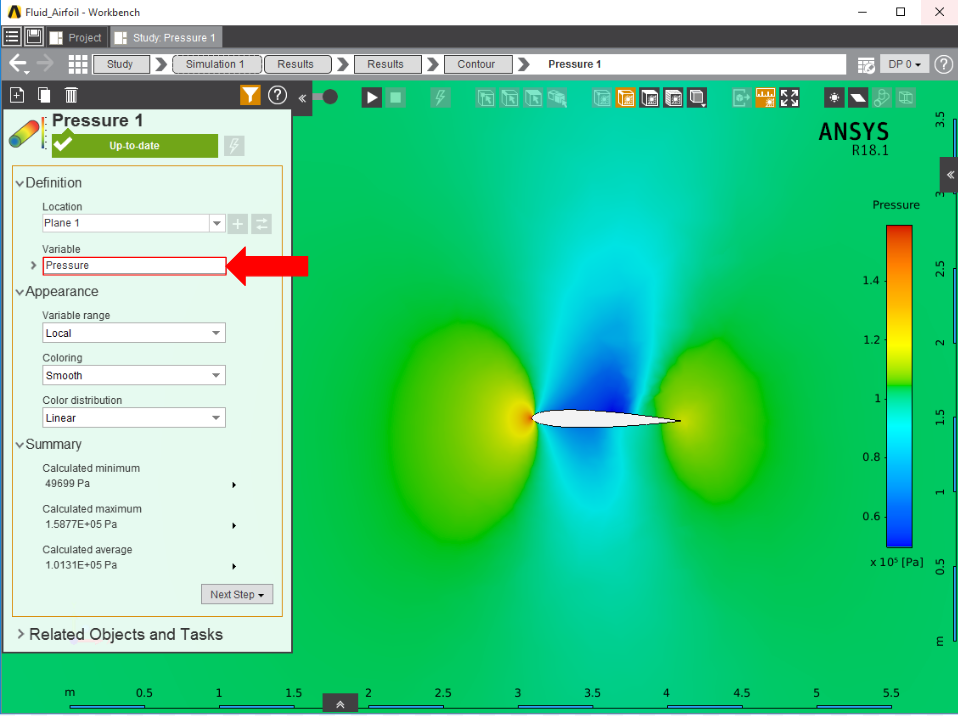
To plot the pressure change, a contour on the side of the flow volume will accurately represent a 2D pressure contour of the flow. Select Contour in the Add drop down menu, select one of the large faces, and assign the Variable to be Pressure.
Go to Step 6: Verification & Validation
...