 Sign-up for free online course on ANSYS simulations!
| Include Page | ||||
|---|---|---|---|---|
|
| Include Page | ||||
|---|---|---|---|---|
|
Verification & Validation
Verification and validation is a formal process for checking results. Each of these terms has a specific meaning which we won't get into here. We'll do two verification checks on our solution:
- We'll check energy conservation by calculating the mixed mean temperature in two different ways.
- We'll refine the mesh and make sure that the results are nearly independent of the mesh.
| Info | ||
|---|---|---|
| ||
Comparison with the experimental measurements is another way you'll check the FLUENT results. |
Check Energy Conservation
We can check energy conservation by calculating the mixed mean temperature via integration of temperature and velocity profiles and comparing it to the value calculated from energy conservation. The latter method was discussed in the Numerical Results section. If energy is conserved in the simulation, the two methods should yield the same mixed mean temperature. The following video shows you the procedure for calculating the mixed mean at x=2.67 m via integration of temperature and velocity profiles. To repeat the calculation at a different axial location, you can right-click on appropriate items in the tree, duplicate and modify as necessary. You need to double-click on an item in the tree to modify it; this is easy to overlook.
| HTML |
|---|
<iframe width="640" height="360" src="//www.youtube.com/embed/YXkGqLC64-Q" frameborder="0" allowfullscreen></iframe> |
Summary of the above video:
- Create a radial line in Outlines Tab
- Click Location in the Toolbar > Line
- Name it x267
- Point 1 2.67 0 0
- Point 2 2.67 0.0294 0
- Apply
- Go to Expressions Tab
- Right click in Expressions > New
- Name Tm267
- Right click in Definition box > Functions > CFD-Post > lineInt
- Right click > Variables > Density
- type *
- Right click > Variables > Temperature
- type *
- Right click > Variables > Velocity u
- type * 2 * pi *
- Right click > Variables > Other > Y
- Right click behind @ sign > Locations > x267
- type /
- Copy the expression before "/" and paste behind "/"
- Delete Temperature in second expression
- Apply
Compare this to the value you obtained in the Numerical Results section.
Refine Mesh
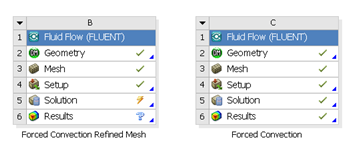
Let's repeat the solution on a finer mesh with smaller cells. In workbench, under Forced Convection project, right click on Fluid Flow (FLUENT) and click duplicate. Rename the duplicate project to Forced Convection Refined Mesh. You should have two project cells in workbench.
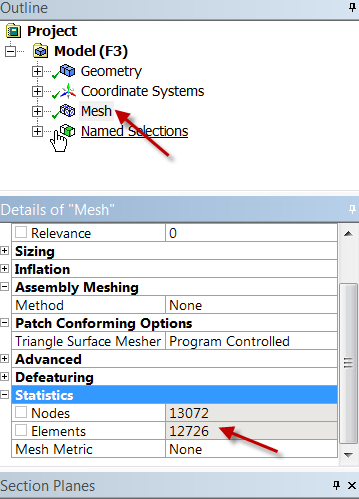
Double click on Mesh for Forced Convection Refined Mesh. The ANSYS Mesher window will open. Under Outline, expand mesh tree and click on Edge Sizing.
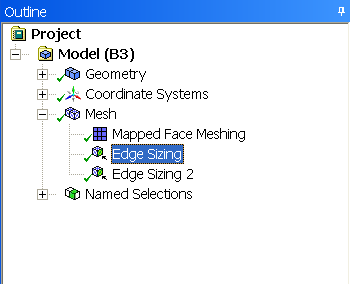
Highlight "Edge Sizing". Under Details of "Edge Sizing", increase Number of Divisions to 50. This will refine the mesh in the radial direction.
Highlight "Edge Sizing 2". Under Details of "Edge Sizing 2", decrease Element Size to be 0.02. This will refine the mesh in the axial direction.
Click Update  to generate the new mesh. If you highlight Mesh in the tree and expand Statistics, you will notice that the number of elements has increased to about 12,800, compared to 5508 of the original mesh.
Close the ANSYS Mesher and go back to Workbench window. Under Forced Convection Refined Mesh, right click on Fluid Flow (FLUENT) and click Update. Wait for a few minutes for FLUENT to obtain a solution on the new mesh and update all the results.
We would want to compare the solution on the two meshes. To do that, drag the Solution cell of Forced Convection Refined Mesh to Results cell of Forced Convection.

Finally, double click on Results cell of Forced Convection to compare the results on the two meshes. Select the Chart Viewer tab near the bottom of the graphics window. Double-click on Centerline Temperature in the Tree view to see the updated results (pretty sweet, huh?).
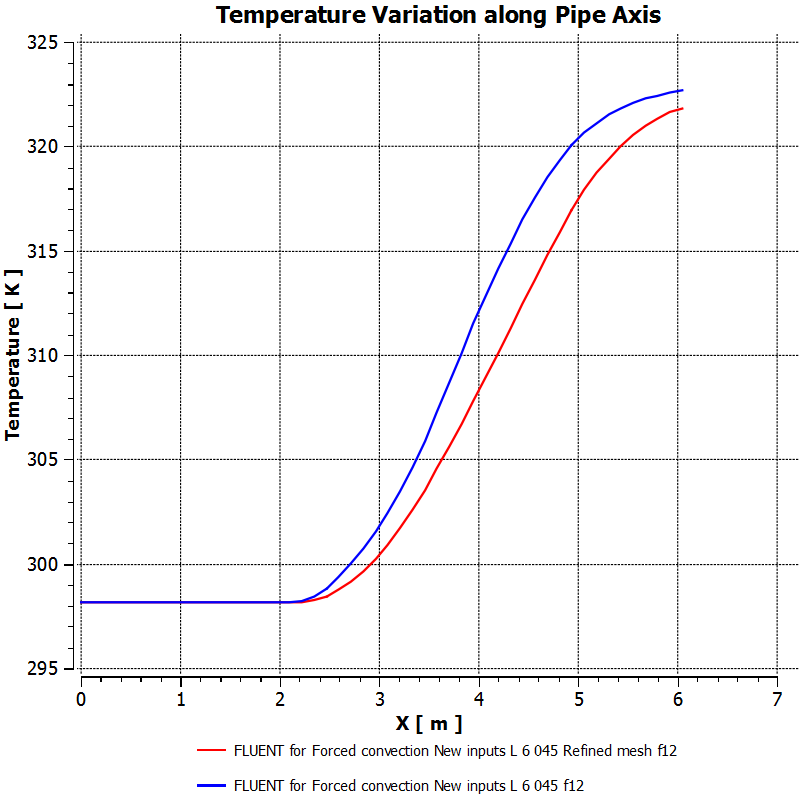
The red line corresponds to the refined mesh. Similarly, one can check wall temperature variation on the two meshes.

Refining the mesh doesn't change the wall temperature much but the centerline temperature changes a fair bit. So another level of mesh refinement would be wise.
Go to Exercises