| Include Page |
|---|
| Pressure Vessel - Panel |
|---|
| Pressure Vessel - Panel |
|---|
|
| Include Page |
|---|
| ANSYS Google Analytics |
|---|
| ANSYS Google Analytics |
|---|
|
Numerical Results
The following video shows how to plot the deformed shape to check if our boundary conditions have been applied correctly.
| Wiki Markup |
|---|
{html}<iframe width="600" height="338" src="//www.youtube.com/embed/7GLabKnRr2I?rel=0" frameborder="0" allowfullscreen></iframe>{html} |
The hoop, axial and radial stresses can be found in a similar fashion.
| Wiki Markup |
|---|
{html}<iframe width="600" height="338" src="//www.youtube.com/embed/jaoQMnjTos4?rel=0" frameborder="0" allowfullscreen></iframe>{html} |
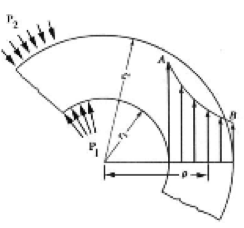
A really neat way to represent hoop stress graphically is by using the “path” tool in ANSYS. The following video shows how to display stress as a function of radius much like the figure below.
| Wiki Markup |
|---|
{html}<iframe width="600" height="338" src="//www.youtube.com/embed/e6V7pTat0cM?rel=0" frameborder="0" allowfullscreen></iframe>{html} |
The “path” tool can also be used to show the axial and radial stresses along the top edge. Try it!
The next video shows how to display the full 3d model by revolving the 2D section 360° about the y-axis. Note that it comes from it different project, but the steps are the same.
| Wiki Markup |
|---|
{html}<iframe width="600" height="338" src="//www.youtube.com/embed/_cvqjodZH7A?rel=0" frameborder="0" allowfullscreen></iframe>{html} |
Go to Step 7: Verification and Validation
Go to all ANSYS Learning Modules
 Sign-up for free online course on ANSYS simulations!