 Sign-up for free online course on ANSYS simulations!
...
| Include Page | ||||
|---|---|---|---|---|
|
Tips for MAE 2120 Project 1
Combining Multiple Plots into One Figure
To present results compactly and succinctly, you can combine plots into one figure. For example, shearing force, bending moments and torque plots for a shaft can be presented in the same figure using the subplot function.
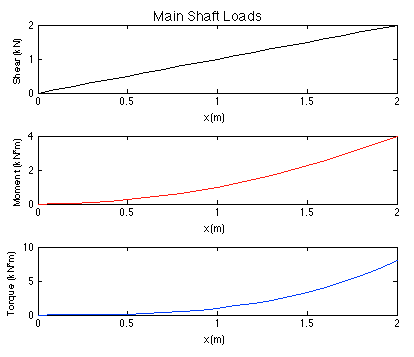
These subplots were generated using the following syntax.
...
For more information on subplots, you can refer yourself to the MATLAB documentation.
Marking Max and Min Locations in Plots
Use the max function to find the maximum value. For example, to find the maximum value of Bending Moment, use:
...

Here is an example script that performs this task. Similarly, you can use the min function to find and mark the minimum value.
Recording Max and Min Values in Plots
The text function can be used to record the maximum or minimum value.
...
Here is our example script which also records the max value of Bending Moment.
More tips...
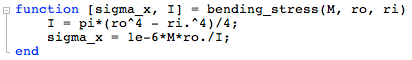
- You can have multiples outputs from a function.
- Example:
- Use cosd(theta) if theta is in degrees.
...