 Sign-up for free online course on ANSYS simulations!
...
Insert a chart and name it "normalized velocity". Select Outlet for the location in Data Series. Select normalized u for the X variable and Y for the Y variable. Click on Apply to view the chart.
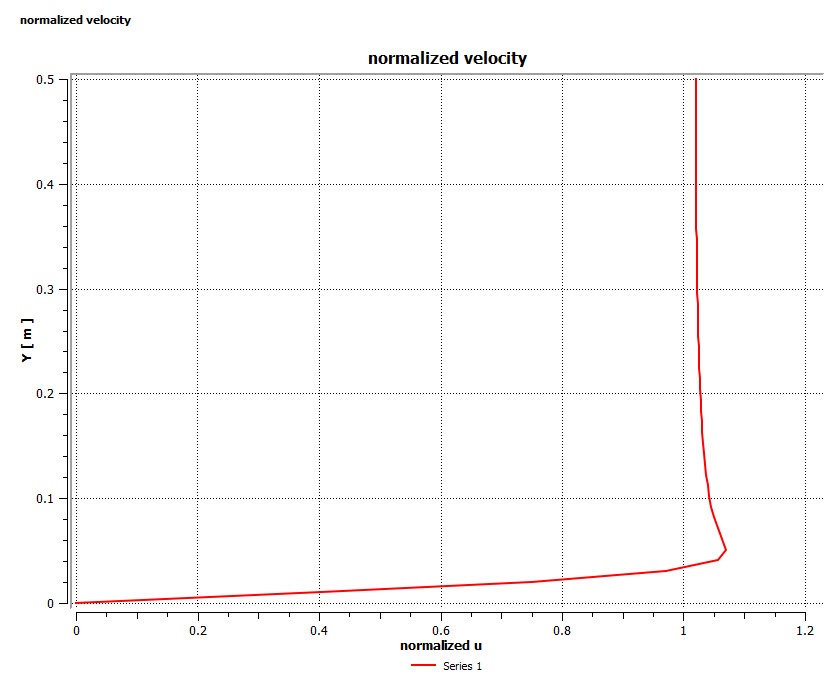
Notice the scale of this profile is exactly the same as that of the outlet velocity profile. This is because the free stream velocity, Uinf, is 1 m/s.
...