 Sign-up for free online course on ANSYS simulations!
...
Click on Apply. The comparison should look like the following plot:
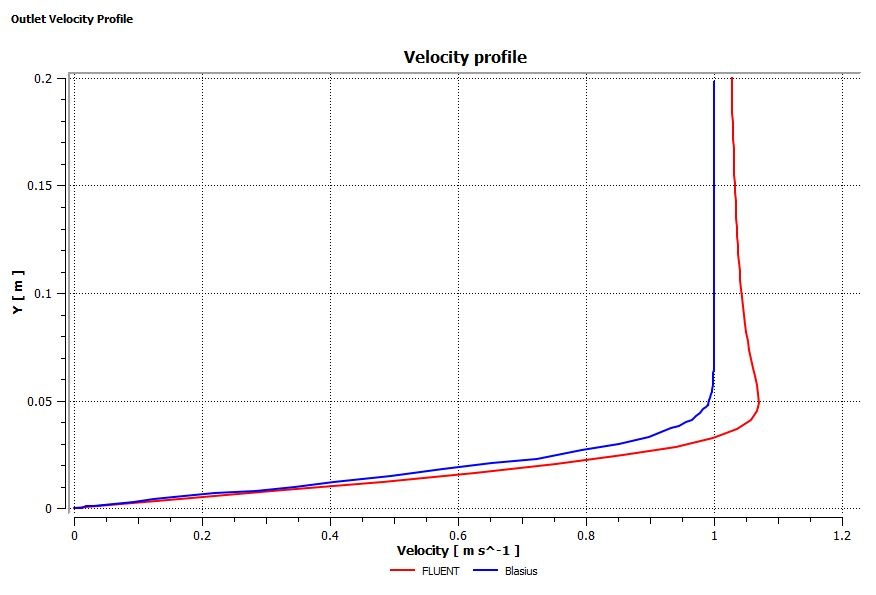
Normalized velocity profile
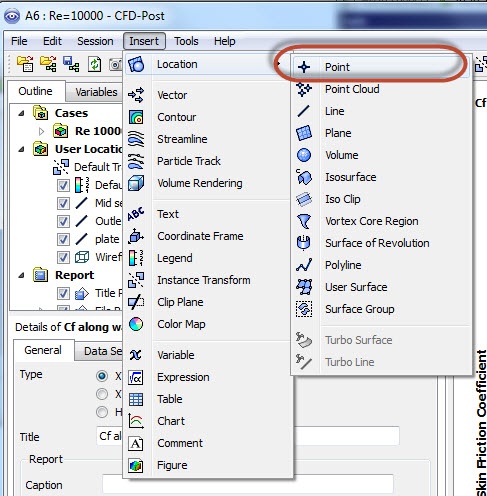
We will observe the normalized velocity (Vx/U_infinity) at the outlet. Insert a point and call it free stream.
Enter the following coordinates and click on Apply.
In the expressions tab, create a new expression and name it "Uinf". In Details of Uinf, enter the following command and click on Apply:
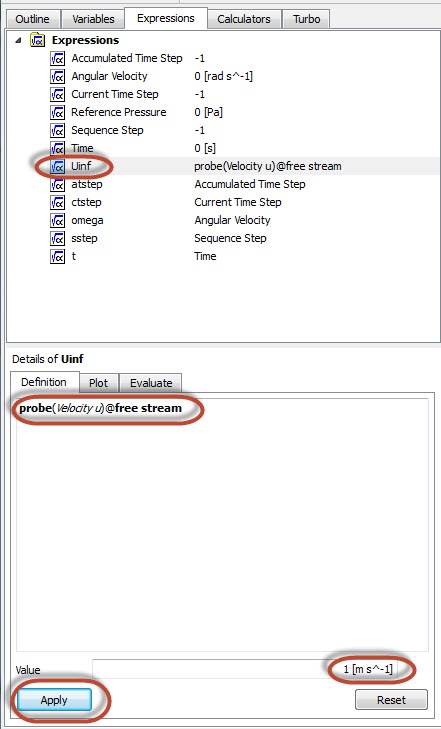
Notice Uinf returns 1 m/s as the velocity at the point where we defined as free stream. This is the same free stream velocity that we have set up in FLUENT.
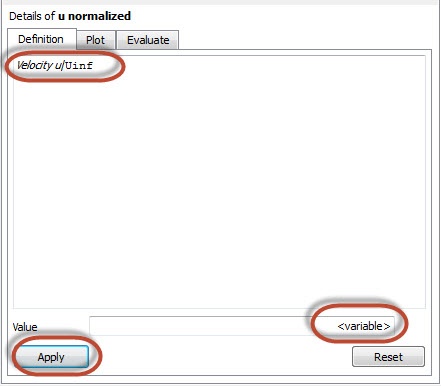
Insert another expression and name it "u normalized". Enter the following command and notice its value is a variable. This is because the x-velocity varies in the y direction.
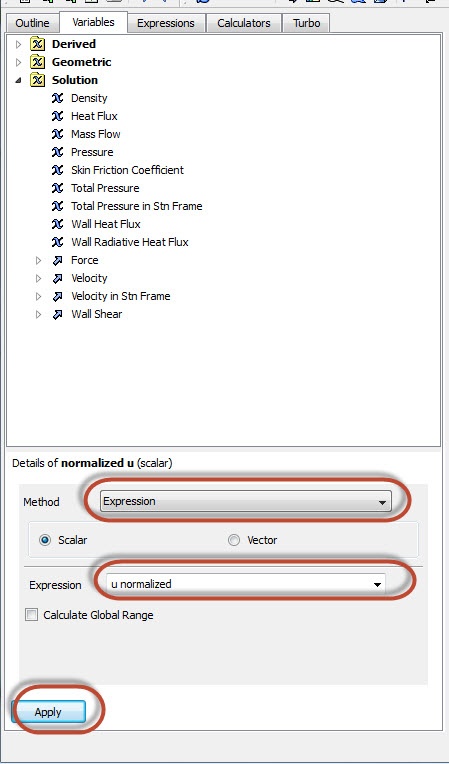
In the Variables tab, create a new variable and name it "normalized u". Retain Expression for the Method and change the expression to "u normalized" from the drop down list. Click on Apply.
Mid-Section Velocity Profile
...