Command issued:
ab -n 50 -c 5 -C 'CA95C0CCCB8E1F02638F8D18B826706D' -v 4 -e kfsstg07182011.csv https://kfs-stg.adminapps.cornell.edu/kfs-stg/portal.jsp![]()
Server Software:
Server Hostname: kfs-stg.adminapps.cornell.edu
Server Port: 443
SSL/TLS Protocol: TLSv1/SSLv3,RC4-MD5,2048,128
Document Path: /kfs-stg/portal.jsp
Document Length: 905 bytes
Concurrency Level: 5
Time taken for tests: 17.474 seconds
Complete requests: 50
Failed requests: 3
(Connect: 0, Receive: 0, Length: 3, Exceptions: 0)
Write errors: 0
Non-2xx responses: 50
Total transferred: 91238 bytes
HTML transferred: 45244 bytes
Requests per second: 2.86 (#/sec) (mean)
Time per request: 1747.433 ms (mean)
Time per request: 349.487 ms (mean, across all concurrent requests)
Transfer rate: 5.10 (Kbytes/sec) received
Connection Times (ms)
min mean(+/-sd) median max
Connect: 114 884 688.6 887 3750
Processing: 134 750 401.0 762 1854
Waiting: 111 440 391.6 252 1708
Total: 332 1634 750.6 1648 4000
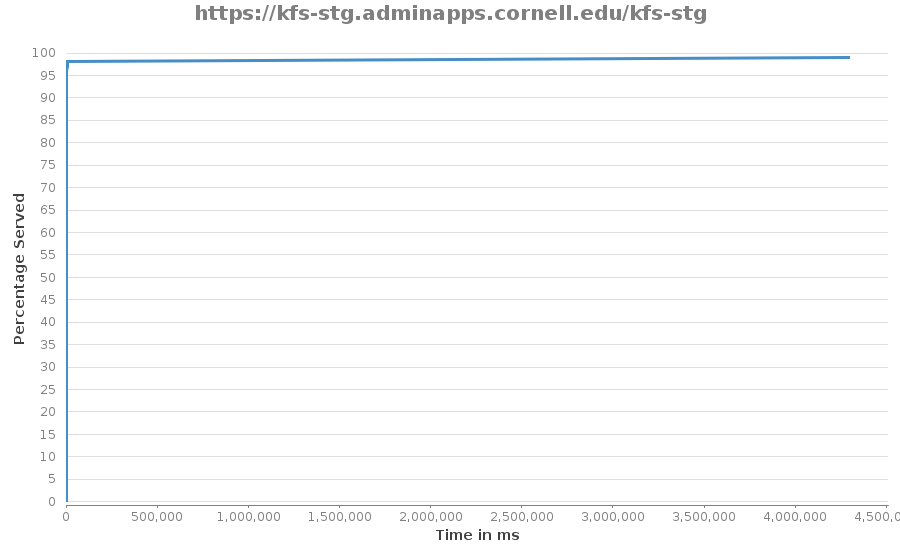
Percentage of the requests served within a certain time (ms)
50% 1648
66% 1798
75% 1983
80% 2130
90% 2686
95% 2860
98% 4000
99% 4000
100% 4000 (longest request)