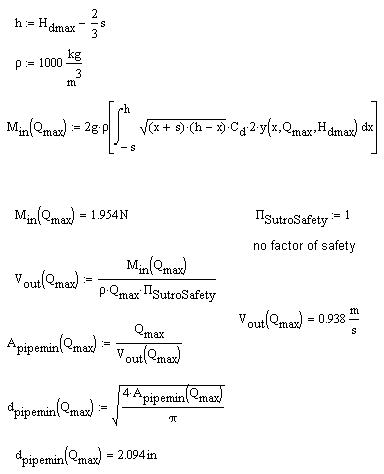

The Point of failure experiment will evaluate the point at which the diameter of the LFOM is too small to accommodate the flow through the riser pipe. At a certain point the water will back up in the pipe and then there won't be free flow from the orifice into the riser pipe. The small diameter riser pipe was tested at the pilot plant. The hypothesized results are a relationship that is the same as the target relationship until failure. The results showed a linear relationship with a lower ratio of flow/depth than the predicted for all flow rates. The hypothesis for these results is that instead of a point of failure there is total failure. If the pipe is inappropriately sized then the LFOM fails for all flow rates.
In order to more accurately calculate the optimal LFOM diameter it is necessary to know the point at which the diameter is too small and will achieve failure. The point of failure experiment will test a prototype design under predicted failure conditions. The point of failure is predicted assuming conservation of momentum.
The documentation of the program used to for these calculations is available here


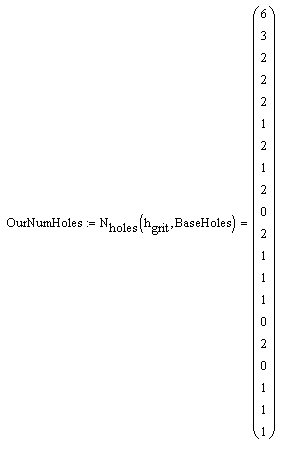
The completed design is shown below. The original entrance tank was used and a series of reducers were used to connect the smaller diameter pipe to the existing hole (that was created for the 3" diameter riser pipe).
The entrance tank with riser pipe was installed in the plant and measurements were taken on the efficiency and accuracy of the design. There is an in-line flow meter that will provide flow rate data that can be compared to the flow rate recorded based on height in the entrance tank. There will be readings at incremental flow rates where the electronic flow meter flow rate and water height will be recorded.
1) Check that ALL holes are clean and free of obstructions
2) Record the flow rate from the flow meter in GPM
3) Record the height of the water in the bucket using a ruler (inches), be sure to place the end of the ruler on the edge to ensure contact with the actual bucket base. the pictures below show the techniques for recording water height.
4) For next reading change the flow rate manually and then wait approximately 5 minutes for the flow to acclimate.
5) Record the stabilized flow rate and the water height.
Figure 1: The sensor with display is pictured above and the model is SITRANS F M MAG 3100, statistics for the sensor are available at the Seimens website.
Figure 2: The microprocessor-based transmitter that displays the data is pictured above and the model is SITRANS F M MAG 6000, statistics are available at the Siemens website.
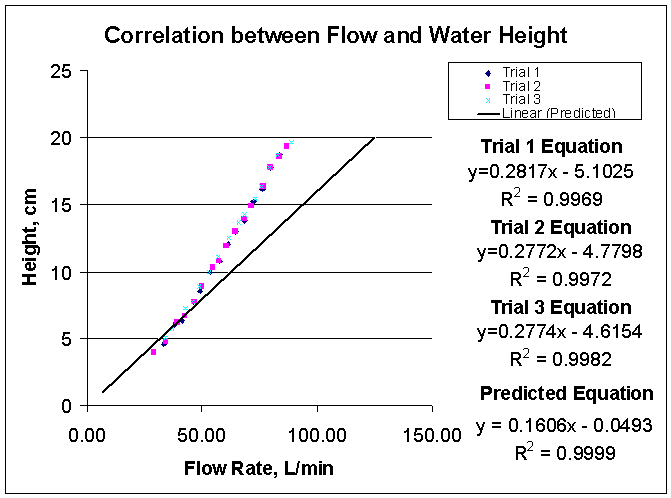
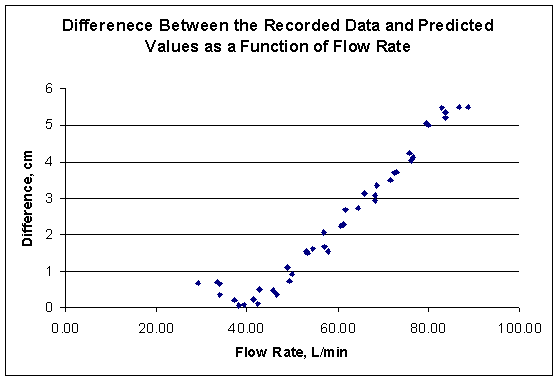
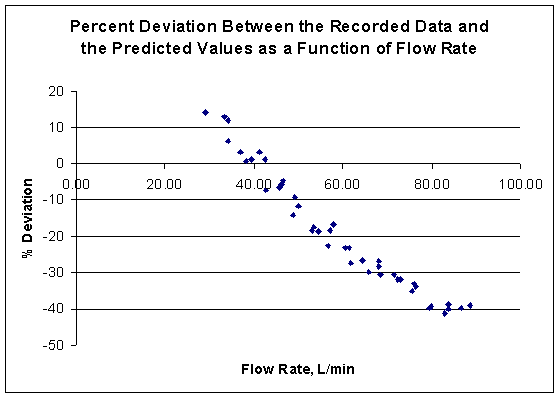
The linear trendline of the data is y = -0.9653x + 38.22, with an R^2 value of 0.9556. This allows us to calculate the flow rate where the error between the predicted and measured flow rates differ by more then 10%. The flow rate of failure is 49.95 L/min which is less than the expected flow rate of failure, 62.5 L/min.
The results of the experiment were contrary to the expected results. Originally it was assumed that there was a certain maximum flow rate for a pipe, if the flow rate exceeded a maximum value the water entering the riser pipe wouldn't be able to leave quickly enough and the water would back up in the pipe. The results showed an alternative situation. The pipe was sized to reach the failure point at 62.5 L/min (half the maximum flow rate of the pilot plant - 125 L/min). The results showed a linear relationship between flow rate and height for all of the flow rates, the difference was that the slope for the pipe had a different slope than the predicted values. The lack of agreement between theory and experimental values over the entire range suggest that the LFOM failed over the entire range of flows.
The perplexing results may be due to the fact that there we were not witnessing a point of failure, a flow rate at which a LFOM will fail, but a complete failure. If the pipe is sized too small to accommodate the flow rate which the orifice pattern is designed to support then the LFOM will fail for all flow rates. This hypothesis would agree with the results. It would be beneficial in future research to test the LFOM created above with a diameter of 1.5 inches with an orifice pattern designed to handle the maximum flow rate for the pipe, 62.5 L/min. It would also be interesting to apply a flow rate in excess of the 62.5 L/min and watch the system for evidence of failure.