|
Author: Ranjith Tirunagari, Cornell University Problem Specification |
Note that there are two types of velocities in an LES simulation - instantaneous velocity and mean velocity. The instantaneous velocity is the actual velocity at any time instant in the domain. When we collect the statistics, the instantaneous velocity is time-averaged to obtain the mean velocity. Let us make a mid-plane in the domain to look at the contour plots of instantaneous axial velocity and the mean axial velocity.
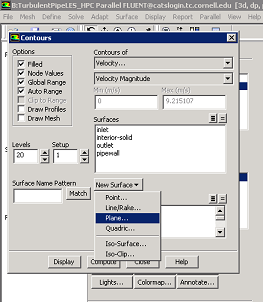
(Click) Graphics and Animation > Contours > Set Up.. as shown in the figure Click Here for Higher Resolution
In the Contours window, click on New Surface > Plane... as shown below.
 Click Here for Higher Resolution
In the Plane Surface window, click Point and Normal. Under Points, choose (x0 (m), y0 (m), z0 (m)) = (0,0.0635,0) and under Normal choose (ix (m), iy (m), iz (m)) = (1,0,0). Name the surface as midplane_les under New Surface Name. Click Create. The plane can be viewed using Graphics and Animations > Mesh > Set Up....
Click Here for Higher Resolution
Go back to Contours window and select Velocity... and Y Velocity under Contours of and under Surfaces choose midplane_les and click Display.
Go to Step 7 - Verification & Validation
Go to all FLUENT Learning Modules