Author: John Singleton, Cornell University

Problem Specification
1. Pre-Analysis & Start-Up
2. Geometry
3. Mesh
4. Setup (Physics)
5. Solution
6. Results
7. Verification and Validation
Exercises

6. Results

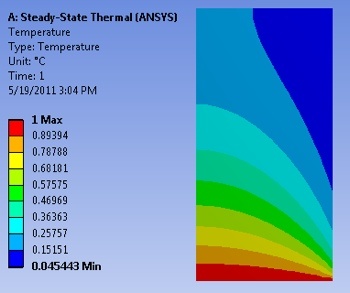
Temperature


https://confluence.cornell.edu/download/attachments/146918520/UnrefTemp_Full.PNG


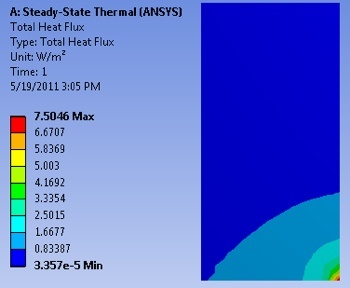
Total Heat Flux


https://confluence.cornell.edu/download/attachments/146918520/UnrefTotalHeatFlux_Full.PNG

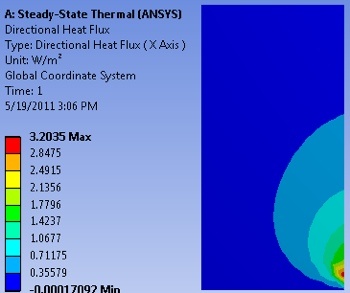
X Direction Heat Flux


https://confluence.cornell.edu/download/attachments/146918520/UnrefDirectHeatFluxXX_Full.PNG

Temperature along Y=1m line

At this point we are interested in extracting the temperature values along the horizontal line, y=1m. First, (Right Click) Model > Insert > Construction Geometry as shown below.
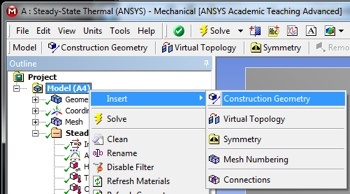

https://confluence.cornell.edu/download/attachments/146918520/InsConstructGeomFull.PNG


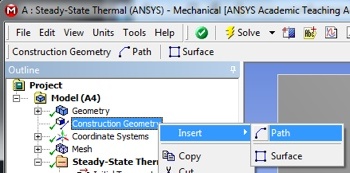
Next, (Right Click) Construction Geometry > Insert > Path as shown in the following image.


https://confluence.cornell.edu/download/attachments/146918520/InsertPath_Full.PNG


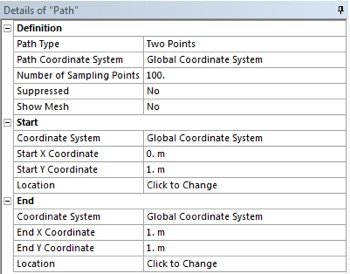
Then, set Number of Sampling Points to 100, set Start X Coordinate to 0, set Start Y Coordinate to 1, set End X Coordinate to 1, and set End Y Coordinate to 1 as shown below.


https://confluence.cornell.edu/download/attachments/146918520/PathDet_Full.PNG


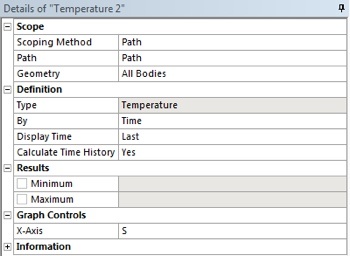
At this point another temperature output must be created. In order to create the temperature output (Right Click) Solution > Insert > Thermal > Temperature. In the "Details of Temperature 2" table set the Scoping Method to Path as shown below. Then, set Path to Path. Your "Details of Temperature 2" table should now look like the following image.


https://confluence.cornell.edu/download/attachments/146918520/DetTemp2_Full.PNG


Now,(Click) Solve, , and ANSYS will find the temperature on the line y=1 m as a function of x position. ANSYS will obtain the temperature for 100 points on the line y=1m. The data points are displayed in a table and can be exported to MATLAB or EXCEL. The following image shows, the graph that ANSYS outputs. The y axis is non-dimensional temperature and the x axis is x position on the line y=1m.


https://confluence.cornell.edu/download/attachments/146918520/PathTempResults_Full.PNG


Save

Save the project now.


Go to Step 7: Verification and Validation

See and rate the complete Learning Module

Go to all ANSYS Learning Modules