 Sign-up for free online course on ANSYS simulations!
Step 8: Postprocess the Results
Enter the postprocessing module to analyze the solution.
Main Menu > General Postproc
Plot Deformed Shape
Main Menu > General Postproc > Plot Results > Deformed Shape
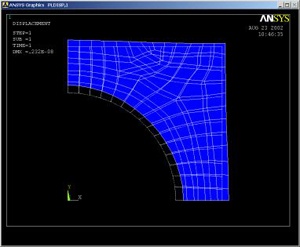
Select Def + undeformed and click OK.
This plots the deformed and undeformed shapes in the Graphics window. The maximum deformation DMX is 0.232E-08m as reported in the Graphics window. Note that the deformation is magnified in the plot so as to be visible.
The deformation would be better visible if the foreground and background were not of the same color. Turn off the background:
Utility Menu > PlotCtrls > Style > Background > Display Picture Background
To get the background back, you just have to select this again.
Animate the deformation:
Utility Menu > PlotCtrls > Animate > Deformed Shape...
Select Def + undeformed and click OK. Select Forward Only in the Animation Controller.
The left and bottom edges move parallel to themselves which means that the full deformed plate is also symmetric about these edges. This shows that the symmetry boundary condition at these edges is imposed correctly. The circular edge of the hole moves outward which is what one would expect from the outward pressure acting along it. Thus, the deformation of the structure agrees with the applied boundary conditions and matches with what one would expect from intuition.
Close the Animation Controller.
Plot Nodal Solution of von Mises Stress
To display the von Mises stress distribution as continuous contours, select
Main Menu > General Postproc > Plot results > Contour Plot > Nodal Solu
Select Nodal Solution > Stress > von Mises stress and click OK.

The contour plot will show you the locations of the maximum and minimum values with the labels MX and MN, respectively. Are these locations where you expect them? SMX and SMN values reported in the Graphics window are the corresponding maximum and minimum stress values.
The diagonal is an additional line of symmetry. How symmetric is your result about the diagonal?
Save this plot to a file:
Utility Menu > PlotCtrls > Hard Copy > To File
Select the file format you want and type in a filename of your choice under Save to: and click OK. Check that the file has been created in your working directory.
When you plot the "Nodal Solution", ANSYS obtains a continuous distribution as follows:
1. It determines the average at each node of the values of all elements connected to the node.
2. Within each element, it linearly interpolates the average nodal value obtained in the previous step.
Plot Element Solution of von Mises Stress
To obtain results without nodal averaging, select
Main Menu > General Postproc > Plot results > Contour Plot > Element Solu
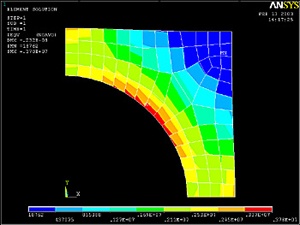
Select Element Solution > Stress > von Mises stress and click OK. This displays the von Mises stress results as discontinuous element contours.
Save this plot to a file: Utility Menu > PlotCtrls > Hard Copy > To File
Element solution contours are determined by linear interpolation within each element but no nodal averaging is performed. The discontinuity between contours of adjacent elements is an indication of the gradient across elements. The inter-element discontinuities in our solution are relatively small compared to the stress levels. This indicates that the mesh resolution is reasonably good.
Query Results
To determine the value of the first principal stress σ1 at a selected location, select
Main Menu > General Postproc > Query Results > Subgrid Solu
This brings up the Query Subgrid Solution Data menu. Select Stress from the left list, 1st principal S1 from the right list and click OK.
This brings up the pick menu. You can click on any location in the geometry and ANSYS will print the σ1 value at that location. Try querying the values at a few locations. Note that the coordinates of the picked location and the corresponding solution value are reported in the pick menu.
Cancel the pick menu.
Go to Step 9: Validate the results