 Sign-up for free online course on ANSYS simulations!
| Include Page | ||||
|---|---|---|---|---|
|
| Include Page | ||||
|---|---|---|---|---|
|
| Note |
|---|
This tutorial was created with an older version of ANSYS (14.5), where the mesh generator and the refinement process was not as strong as it is now. This will result in a different solution than the one shown. (In ANSYS 16.1, the optimization results in a radius of ~1.25in-1.27in and in ANSYS 2019 R2 the optimization results in a radius of ~1.11-1.13in) |
Response Surface
In this step, ANSYS builds a surface by interpolating the discrete sampling points selected in the previous step. This can be thought of as building a model of the terrain in the design space.
Start by double clicking on Response Surface in the Project Schematic window. Once the Response Surface window opens click Update. After, the update has completed click on Response to see a plot of the volume as a function of hole radius.
Note: Don't worry if you are using a newer version of ANSYS and your results don't quite match the results shown here. In version 2019 R2, we found the maximum von Mises stress to vary between 32.39 ksi and 34.22 ksi for the given input parameters, instead of between 31.91 ksi and 34.16 ksi as shown here.
Volume
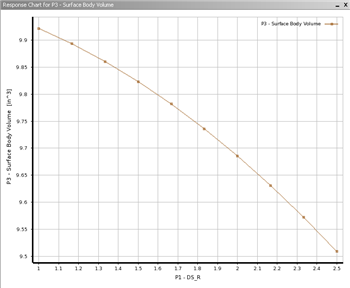
The first plot which should appear shows the volume of the quarter plate as a function of the hole radius, and is shown below.
| newwindow | ||||
|---|---|---|---|---|
| ||||
https://confluence.cornell.edu/download/attachments/131466103/SurBodyVol_Response_Full.png |
The relation between radius and volume is quite trivial to compute. It will simply be the area of the surface multiplied by the thickness of the surface. With this in mind, V=t*(h*w-(1/4)*pi*r^2) where V=volume, t=thickness, h=height, w=width and r=radius.
Maximum Von Mises Stress
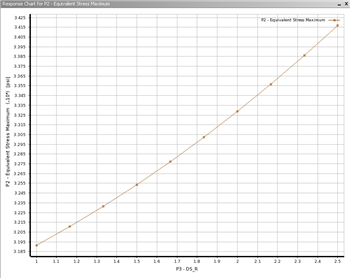
In order to display a plot of the maximum von Mises stress as a function of the hole radius, change the value assigned to Y axis to P3-Equivalent (von-Mises) Stress Maximum. The plot below shows the maximum Von Mises stress as a function of the hole radius.
| newwindow | ||||
|---|---|---|---|---|
| ||||
https://confluence.cornell.edu/download/attachments/131466103/EquivStress_Response_Full.png |
As expected, the maximum Von Mises Stress increases as the radius increases. You can use this graph to get an idea of what radius might constitute the upper limit in accordance with our constraint of 32.5 ksi. Remember that to minimize volume, you want the greatest radius possible that still creates an equivalent Von Mises stress under our constraint. Taking a close look will tell you that you should expect an optimal radius of around 1.5 inches.
At this point, click Return To Project and then save the project.